
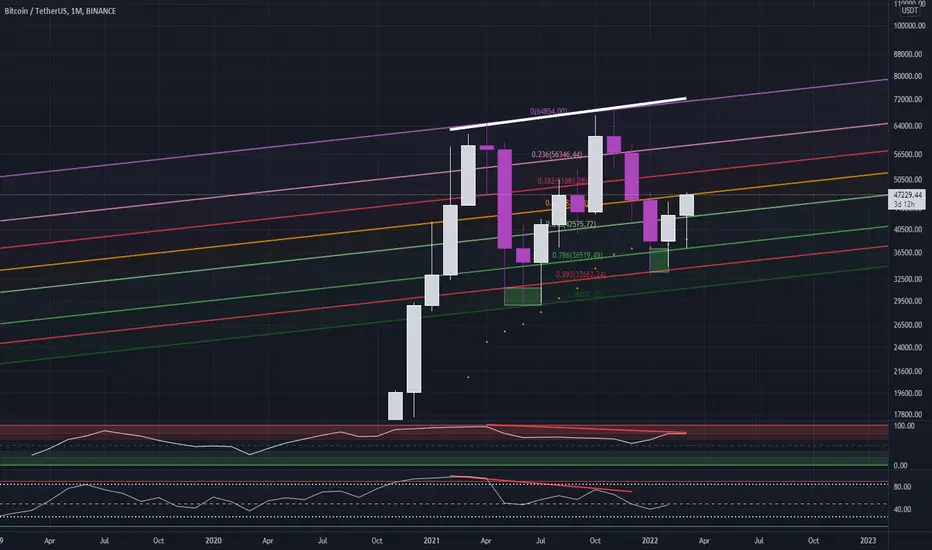
Hi guys I was looking at the weekly chart for bitcoin and I noticed something on the rsi. A huge hidden bearish divergence can be seen from last year's top to this year's top. I am still very bullish on bitcoin and do hope that this does not affect the price action of bitcoin in the following weeks to months even though we have had a massive break out to the 40k levels. Just a warning to be cautious. Just wanted to point that out in the case bitcoin dumps back down lower.
ノート
Apologies I meant the monthly chart not the weekly one. Thank you cschena123
ノート
However the hidden bearish can also be seen on the weekly chart as well!
関連の投稿
免責事項
これらの情報および投稿は、TradingViewが提供または承認する金融、投資、取引、またはその他の種類の助言もしくは推奨であることを意図したものではなく、またこれらに該当するものでもありません。詳細は利用規約をご覧ください。
免責事項
これらの情報および投稿は、TradingViewが提供または承認する金融、投資、取引、またはその他の種類の助言もしくは推奨であることを意図したものではなく、またこれらに該当するものでもありません。詳細は利用規約をご覧ください。