
Hi, traders!
Today we’ll continue our series of educational articles. We hope you enjoyed the previous one and found it useful.
We have already told about the necessity of identifying a trend. Most of freshmen and even experienced traders find it really difficult. There is even more difficult problem, though. Finding the most profitable points of entrance and exit is very complicated task for anybody. However, technical analysis gives traders some tools and techniques that simplify this task greatly. Today we’ll talk about Parabolic SAR (PSAR), one of the best indicators for identifying trend reverses.
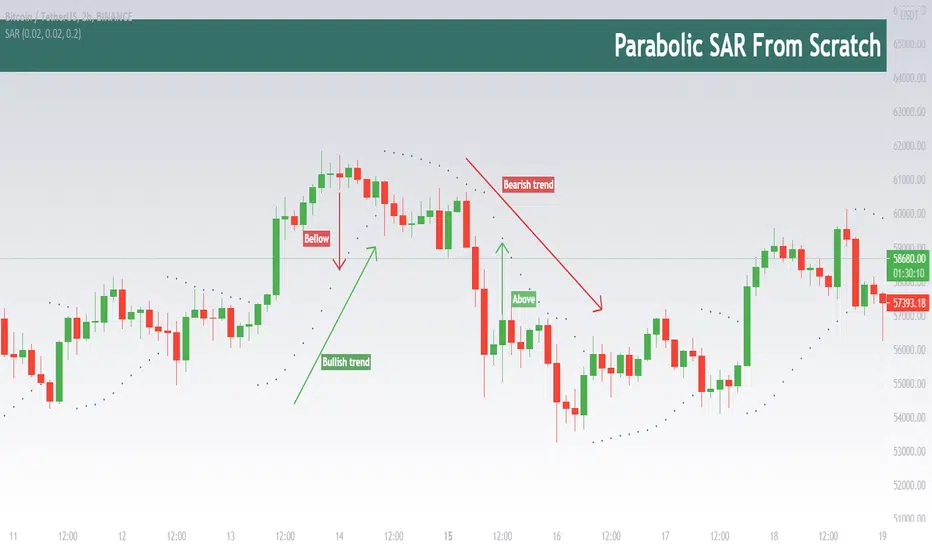
Let’s have a look at it. PSAR is the line of dots which is plotted below or above the price candles. When the trend is bullish the dots are below the candles, when the trend is bearish they are above. PSAR calculation is rather difficult and we don’t want to bore you. One you should know is the main parameters – step and maximum step (default 0.02 and 0.2). When you increase this values, you increase the sensitivity of indicator, but at the same time sacrifice its precision, cause it starts catching lots of false signals. Whereas we decrease these values sensitivity becomes less, but signals are more accurate. Thus, it’s very important to find balance, in order to minimize lagging and get accurate signals.
Today we’ll continue our series of educational articles. We hope you enjoyed the previous one and found it useful.
We have already told about the necessity of identifying a trend. Most of freshmen and even experienced traders find it really difficult. There is even more difficult problem, though. Finding the most profitable points of entrance and exit is very complicated task for anybody. However, technical analysis gives traders some tools and techniques that simplify this task greatly. Today we’ll talk about Parabolic SAR (PSAR), one of the best indicators for identifying trend reverses.
Let’s have a look at it. PSAR is the line of dots which is plotted below or above the price candles. When the trend is bullish the dots are below the candles, when the trend is bearish they are above. PSAR calculation is rather difficult and we don’t want to bore you. One you should know is the main parameters – step and maximum step (default 0.02 and 0.2). When you increase this values, you increase the sensitivity of indicator, but at the same time sacrifice its precision, cause it starts catching lots of false signals. Whereas we decrease these values sensitivity becomes less, but signals are more accurate. Thus, it’s very important to find balance, in order to minimize lagging and get accurate signals.
ノート
ノート
Comment: How to trade with Parabolic SAR?Initially, we must warn you: this indicator works well only on strong trending markets. Using PSAR on choppy markets can be deadly for your budget. So, if the market has a strong trend, that’s a good idea to use PSAR. We usually use it on higher timeframes to avoid contradicting signals that are caused by noises on lower timeframes. H4 or D1 timeframes are ok.
As for signals, we find it a perfect signal to close the position. In fact, if you are in long position and PSAR starts to be pointed above except below the candles, you should sell. At the same time, when it moves below and you are in short, it’s a good signal to close the position.
However, the best usage of this indicator is in tandem with Ichimoku cloud. We’ll study out it properly in the next article.
We hope you enjoy out tutorials. If you have any wishes, write them in comments.
ノート
DISCLAMER: Information is provided only for educational purposes. Do your own study before taking any actions or decisions.
Turn TradingView indicator & strategy alerts into automated trades on major crypto exchanges using no-code bots
Start free at skyrexio.com
Start free at skyrexio.com
免責事項
これらの情報および投稿は、TradingViewが提供または承認する金融、投資、取引、またはその他の種類の助言もしくは推奨であることを意図したものではなく、またこれらに該当するものでもありません。詳細は利用規約をご覧ください。
Turn TradingView indicator & strategy alerts into automated trades on major crypto exchanges using no-code bots
Start free at skyrexio.com
Start free at skyrexio.com
免責事項
これらの情報および投稿は、TradingViewが提供または承認する金融、投資、取引、またはその他の種類の助言もしくは推奨であることを意図したものではなく、またこれらに該当するものでもありません。詳細は利用規約をご覧ください。