
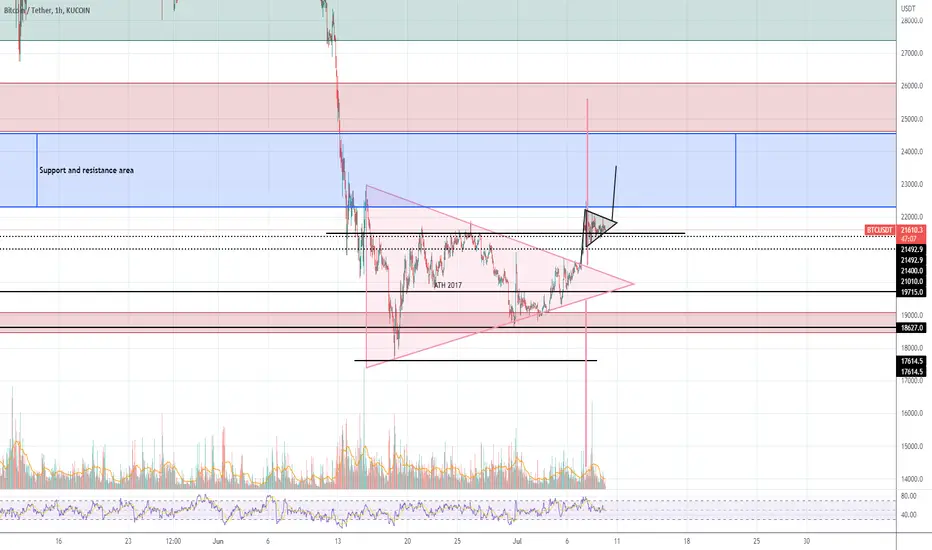
I think that we are seeing a Bull Flag pattern on the hourly charts. If it plays out, it could push the price of BTC to $23.500.
Even though there is heavy resistance at the 22.3k level, I think it is very likely that we will be seeing 23k Bitcoin price this week.
The Bull Flag is also inline with my other analysys > Symmetrical Triangle
Even though there is heavy resistance at the 22.3k level, I think it is very likely that we will be seeing 23k Bitcoin price this week.
The Bull Flag is also inline with my other analysys > Symmetrical Triangle
ノート
Bull Flag dit not play out. It looks like BTC is testing the Symmetrical Triangle for support. 
関連の投稿
免責事項
これらの情報および投稿は、TradingViewが提供または承認する金融、投資、取引、またはその他の種類の助言もしくは推奨であることを意図したものではなく、またこれらに該当するものでもありません。詳細は利用規約をご覧ください。
免責事項
これらの情報および投稿は、TradingViewが提供または承認する金融、投資、取引、またはその他の種類の助言もしくは推奨であることを意図したものではなく、またこれらに該当するものでもありません。詳細は利用規約をご覧ください。