検索
プロダクト
コミュニティ
マーケット
ブローカー
その他
JA
始めましょう
Bitcoin / TetherUS
ショート
アップデート済
2022年3月1日
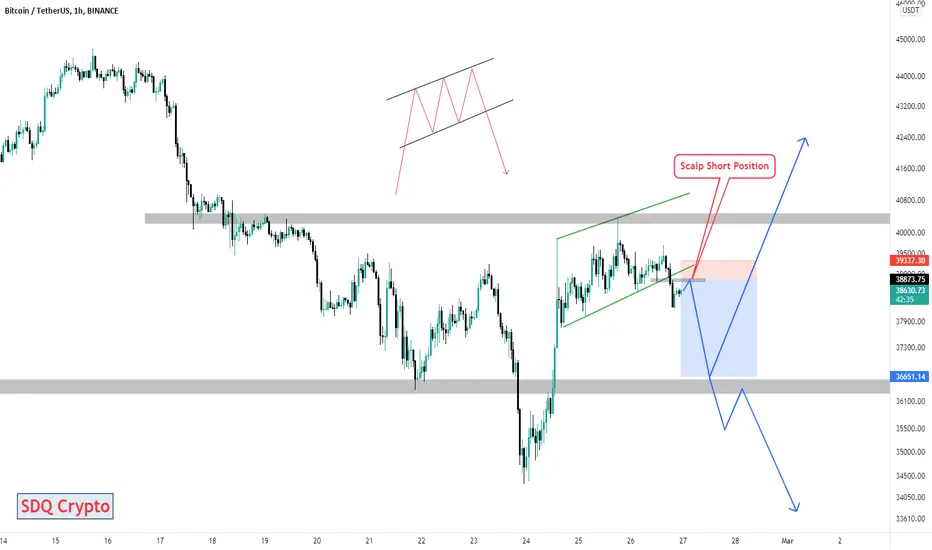
Bitcoin (BTCUSDT) 1H Short Position
3
5
このチャートを取得
14
1 962
2022年2月27日
Bitcoin is showing weakness below the resistance of 39,500. To climb, you have to re-test the range of 36,500 to 37,100, and this can be used as a short-term shortening.
2022年2月27日
手動でトレードを終了しました
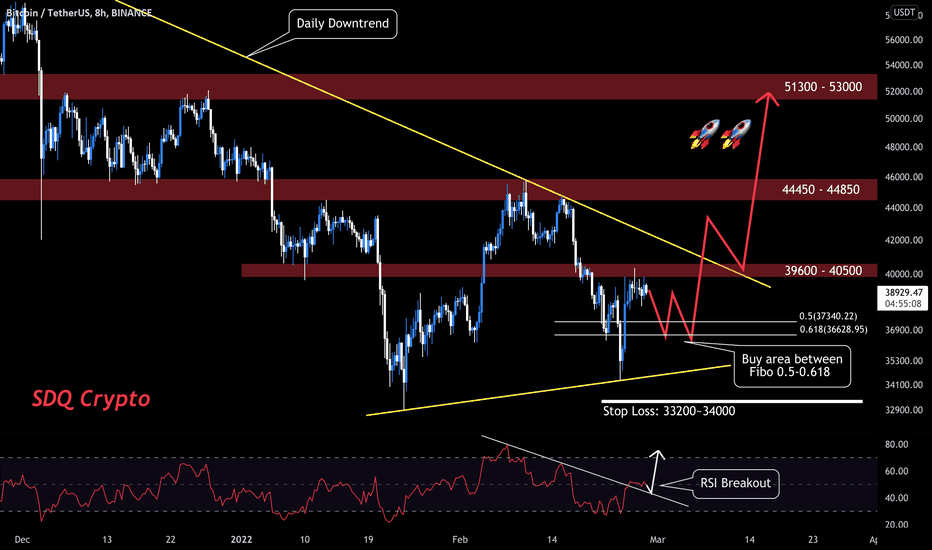
Hi dears. I see upward conditions through last BTC chart
2022年3月1日
トレード稼働中
Bitcoin moves on my way. Just follow the arrows
GPTradersHub
フォロー
フォロー中
他のメディア:
Bitcoin (Cryptocurrency)
BTC
BTCUSDT
Chart Patterns
EURUSD
Gold
Technical Indicators
Oil
russia
Trend Analysis
WAR
XAUUSD
関連の投稿
Bitcoin Long Position 22.2.25
GPTradersHubの投稿
Bitcoin bull run time? 22.2.26
GPTradersHubの投稿
免責事項
これらの情報および投稿は、TradingViewが提供または承認する金融、投資、取引、またはその他の種類の助言もしくは推奨であることを意図したものではなく、またこれらに該当するものでもありません。詳細は
利用規約
をご覧ください。
Bitcoin (Cryptocurrency)
BTC
BTCUSDT
Chart Patterns
EURUSD
Gold
Technical Indicators
Oil
russia
Trend Analysis
WAR
XAUUSD
GPTradersHub
フォロー
フォロー中
他のメディア:
関連の投稿
Bitcoin Long Position 22.2.25
GPTradersHubの投稿
Bitcoin bull run time? 22.2.26
GPTradersHubの投稿
免責事項
これらの情報および投稿は、TradingViewが提供または承認する金融、投資、取引、またはその他の種類の助言もしくは推奨であることを意図したものではなく、またこれらに該当するものでもありません。詳細は
利用規約
をご覧ください。