
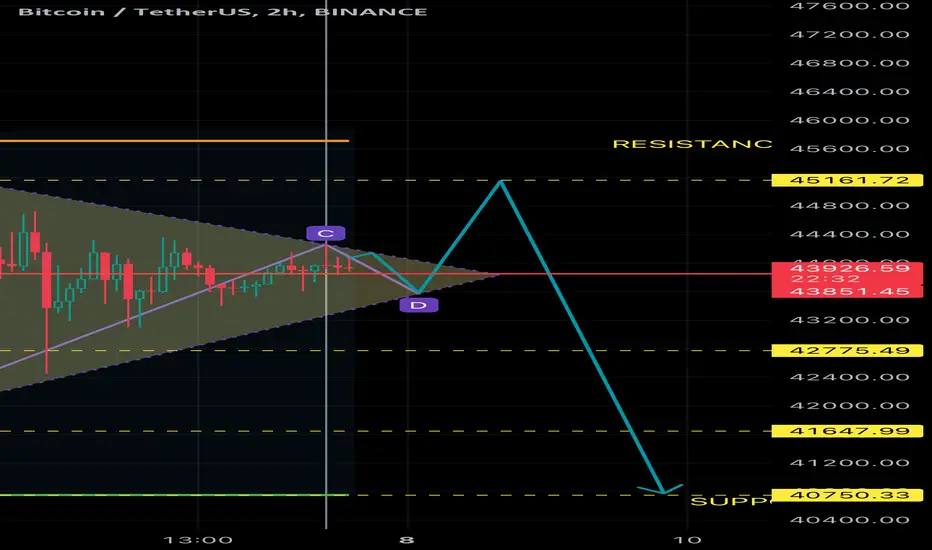
Using the peak of our latest high we can form a triangle that has not been broken out of. The volume profile aligns with the centre of the triangle and provides another line of resistance if BTC breaks up. Similarly the volume shows us how BTC might have multiple areas of resistance of it the breaks down. You’re welcome!

免責事項
これらの情報および投稿は、TradingViewが提供または承認する金融、投資、取引、またはその他の種類の助言もしくは推奨であることを意図したものではなく、またこれらに該当するものでもありません。詳細は利用規約をご覧ください。
免責事項
これらの情報および投稿は、TradingViewが提供または承認する金融、投資、取引、またはその他の種類の助言もしくは推奨であることを意図したものではなく、またこれらに該当するものでもありません。詳細は利用規約をご覧ください。