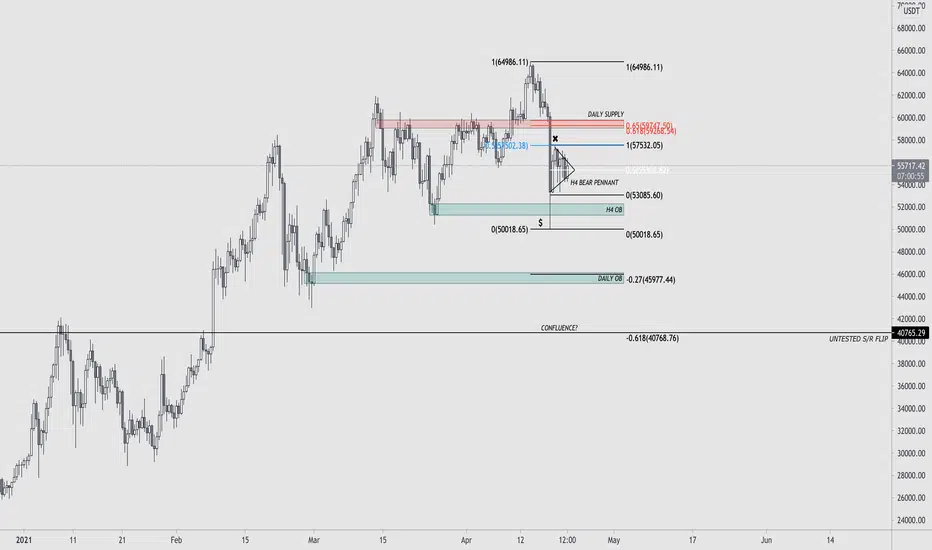
 BTC HTF chart.
The fib levels are scary accurate on the supply & demand areas
Forming a H4 bear pennant
Bunch of stops below $50k to wipe out, most likely causing another liq cascade
-0.168 perfectly aligning with the untested S/R flip at $40k
Judge for yourself.

免責事項
これらの情報および投稿は、TradingViewが提供または承認する金融、投資、取引、またはその他の種類の助言もしくは推奨であることを意図したものではなく、またこれらに該当するものでもありません。詳細は利用規約をご覧ください。
免責事項
これらの情報および投稿は、TradingViewが提供または承認する金融、投資、取引、またはその他の種類の助言もしくは推奨であることを意図したものではなく、またこれらに該当するものでもありません。詳細は利用規約をご覧ください。