
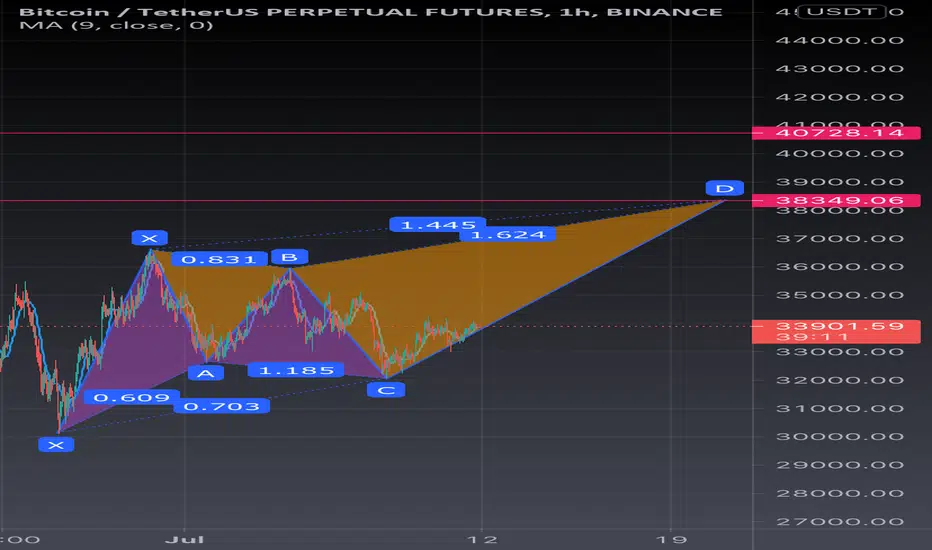
Let’s now see what the bearish Shark pattern appears like.
Below you can see an illustration of the bearish variety of the Shark pattern along with the key Fibonacci relationships within the structure.
bearish-shark-pattern
OX price leg – This is the initial bearish impulsive price move.
XA price leg – This leg retraces a portion of the initial OX leg.
AB price leg – This leg extends beyond the swing low at point X. Point B should terminate within the range of 113 to 161% of the XA leg.
BC price leg – As price moves higher, Point C should terminate at a level that corresponds to 161% to 224% projection of the XA leg. Moreover, point C should retrace to 88% to 113% of the OX leg.
Now let’s discuss the main Fibonacci relationships and trade management rules as it pertains to the bearish variety of the Shark pattern.
Below you can see an illustration of the bearish variety of the Shark pattern along with the key Fibonacci relationships within the structure.
bearish-shark-pattern
OX price leg – This is the initial bearish impulsive price move.
XA price leg – This leg retraces a portion of the initial OX leg.
AB price leg – This leg extends beyond the swing low at point X. Point B should terminate within the range of 113 to 161% of the XA leg.
BC price leg – As price moves higher, Point C should terminate at a level that corresponds to 161% to 224% projection of the XA leg. Moreover, point C should retrace to 88% to 113% of the OX leg.
Now let’s discuss the main Fibonacci relationships and trade management rules as it pertains to the bearish variety of the Shark pattern.

免責事項
これらの情報および投稿は、TradingViewが提供または承認する金融、投資、取引、またはその他の種類の助言もしくは推奨であることを意図したものではなく、またこれらに該当するものでもありません。詳細は利用規約をご覧ください。
免責事項
これらの情報および投稿は、TradingViewが提供または承認する金融、投資、取引、またはその他の種類の助言もしくは推奨であることを意図したものではなく、またこれらに該当するものでもありません。詳細は利用規約をご覧ください。