BTGUSD remains in the range of $ 200- $ 400
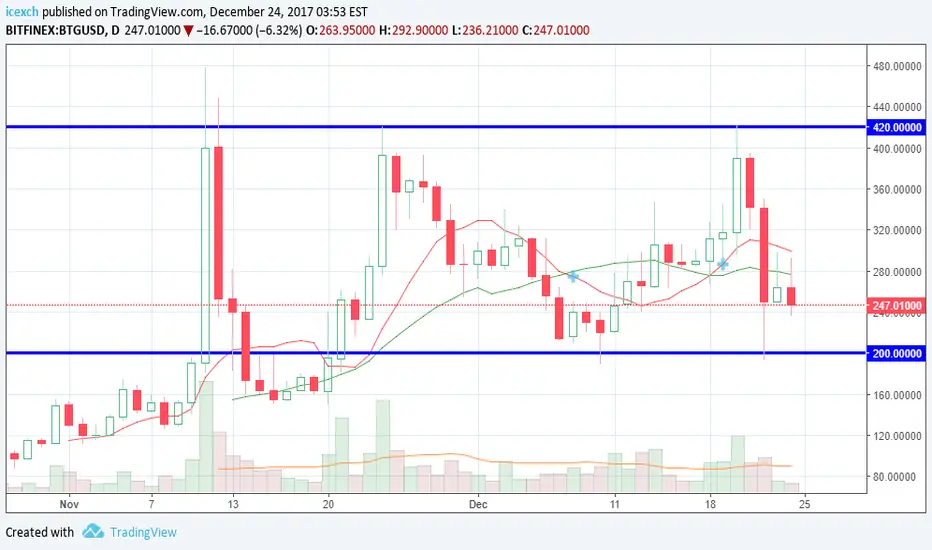
The next (already third) attempt of BTGUSD to grow beyond $ 400 has suffered a fiasco.
Previous down movements stopped by buyers at the turn of $ 200
The slow moving average on the chart is almost horizontal throughout December.
There are all signs of a flat trend.
Trading in a flat trend is very simple: buy from the lower border and sell at the top one.
The only difficulty you can face is the fact that there may be shortages or, conversely, jumps from these lines.
Exit from the range - the day closing outside of it (and preferably two days for reliability)
Recommendation: Buy for $ 200 to sell for $ 400
Previous down movements stopped by buyers at the turn of $ 200
The slow moving average on the chart is almost horizontal throughout December.
There are all signs of a flat trend.
Trading in a flat trend is very simple: buy from the lower border and sell at the top one.
The only difficulty you can face is the fact that there may be shortages or, conversely, jumps from these lines.
Exit from the range - the day closing outside of it (and preferably two days for reliability)
Recommendation: Buy for $ 200 to sell for $ 400

免責事項
これらの情報および投稿は、TradingViewが提供または承認する金融、投資、取引、またはその他の種類の助言もしくは推奨であることを意図したものではなく、またこれらに該当するものでもありません。詳細は利用規約をご覧ください。
免責事項
これらの情報および投稿は、TradingViewが提供または承認する金融、投資、取引、またはその他の種類の助言もしくは推奨であることを意図したものではなく、またこれらに該当するものでもありません。詳細は利用規約をご覧ください。