ロング
BTS/BTS showing Bullish Divergence on 1D
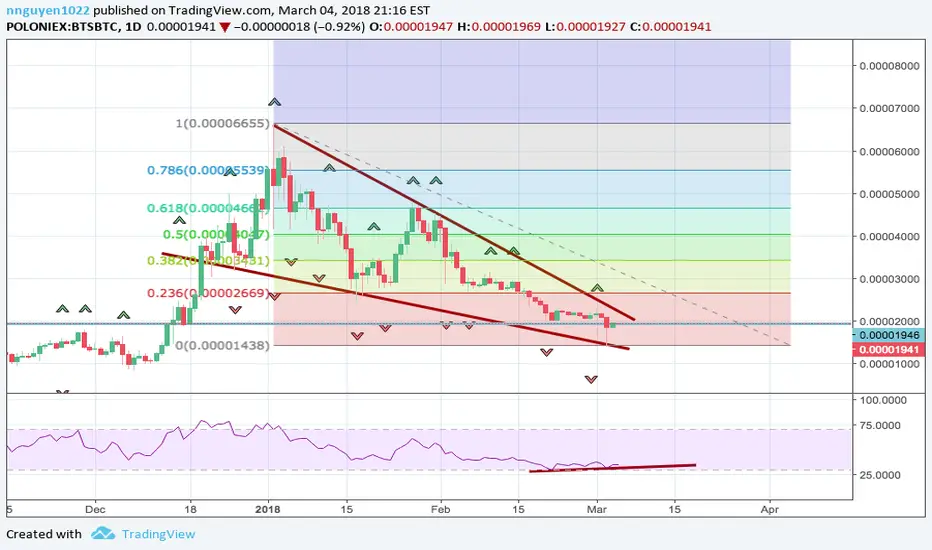
BTS has retraced 78% from previous high from 1/2. BTS is also showing a falling wedge with top diagonal showing resistance. This can be a possible scalp trade while BTS is testing resistance. RSI is showing a bullish divergence from the chart making lower lows and higher lows on the the RSI. Previous bullish divergence back in Oct had a 680% price increase over about 77 days. Not saying lighting will strike twice, but history tends to repeat itself. With a signal of a bullish divergence and breaking of the wedge, we have lift off!

免責事項
これらの情報および投稿は、TradingViewが提供または承認する金融、投資、取引、またはその他の種類の助言もしくは推奨であることを意図したものではなく、またこれらに該当するものでもありません。詳細は利用規約をご覧ください。
免責事項
これらの情報および投稿は、TradingViewが提供または承認する金融、投資、取引、またはその他の種類の助言もしくは推奨であることを意図したものではなく、またこれらに該当するものでもありません。詳細は利用規約をご覧ください。