
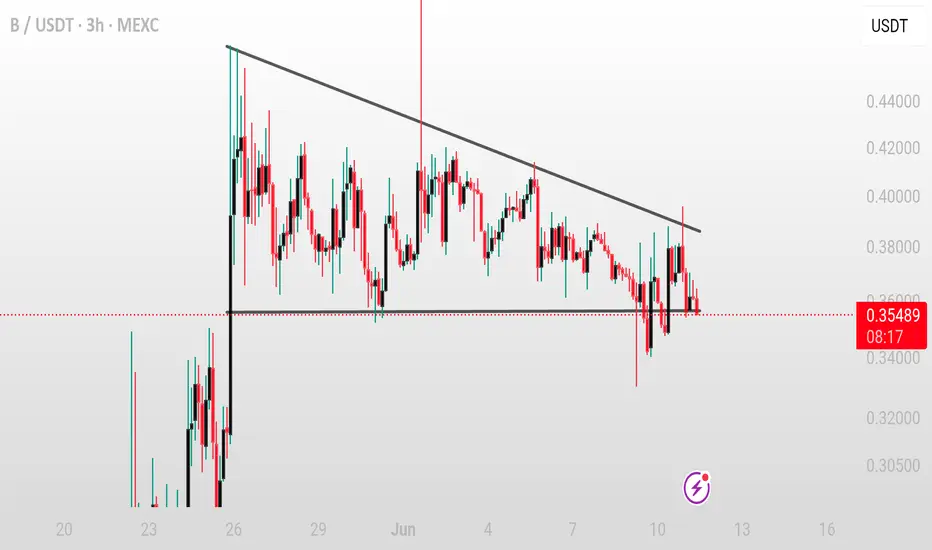
B/USDT – Descending Triangle Breakdown
pattern: descending triangle
timeframe: 3H ⏱️
status: support broken – breakdown in progress ⚠️
idea:
B has broken below key horizontal support at 0.3500–0.3550. If price sustains below and rejects this level on retest, further downside is likely 🔻
entry (confirmation): below 0.3500 or on retest rejection ❗
targets:
– tp1: 0.3300 🎯
– tp2: 0.3100 🎯
– tp3: 0.2900 or lower 🎯
stop loss: above 0.3650 or recent breakdown candle 🛑
note: breakdown with low volume could be a fakeout, wait for confirmation ⚠️
pattern: descending triangle
timeframe: 3H ⏱️
status: support broken – breakdown in progress ⚠️
idea:
B has broken below key horizontal support at 0.3500–0.3550. If price sustains below and rejects this level on retest, further downside is likely 🔻
entry (confirmation): below 0.3500 or on retest rejection ❗
targets:
– tp1: 0.3300 🎯
– tp2: 0.3100 🎯
– tp3: 0.2900 or lower 🎯
stop loss: above 0.3650 or recent breakdown candle 🛑
note: breakdown with low volume could be a fakeout, wait for confirmation ⚠️

免責事項
これらの情報および投稿は、TradingViewが提供または承認する金融、投資、取引、またはその他の種類の助言もしくは推奨であることを意図したものではなく、またこれらに該当するものでもありません。詳細は利用規約をご覧ください。
免責事項
これらの情報および投稿は、TradingViewが提供または承認する金融、投資、取引、またはその他の種類の助言もしくは推奨であることを意図したものではなく、またこれらに該当するものでもありません。詳細は利用規約をご覧ください。