
WEEKLY CHART

DAILY CHART

Main Support Lines
$136.38
$57.55
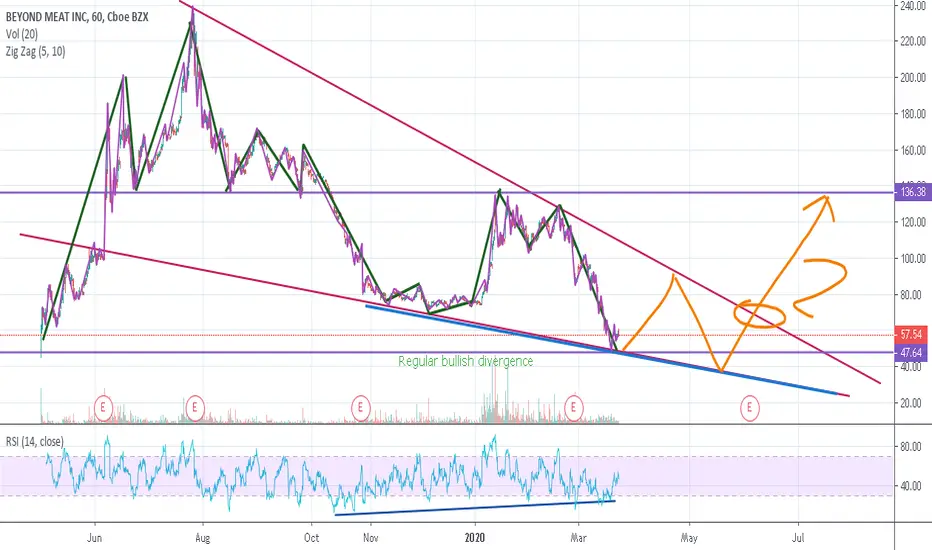
As we can three in the weekly, daily, 1-hour chart of Beyond meat we can see 2 main thing. First the falling wedge and second a regular bullish divergence.
1. Falling Wedge
We can see it clearly in all the charts forming with the 2 main trendlines forming it with the purple colour.
2.Divergence
We can spot the 1st divergence in the daily chart with the blue colour when as price dropping the rsi indicator is rising. The same thing we can see in the 1-hour price chart
SCENARIO
Both the falling wedge and the regular bullish divergence indicates that in sometime the price will break the wedge with breakout, and ultimate go to the support at 136$
DAILY CHART
Main Support Lines
$136.38
$57.55
As we can three in the weekly, daily, 1-hour chart of Beyond meat we can see 2 main thing. First the falling wedge and second a regular bullish divergence.
1. Falling Wedge
We can see it clearly in all the charts forming with the 2 main trendlines forming it with the purple colour.
2.Divergence
We can spot the 1st divergence in the daily chart with the blue colour when as price dropping the rsi indicator is rising. The same thing we can see in the 1-hour price chart
SCENARIO
Both the falling wedge and the regular bullish divergence indicates that in sometime the price will break the wedge with breakout, and ultimate go to the support at 136$
ノート
Testing the strong resistance at 136$. lets see how it will go
免責事項
これらの情報および投稿は、TradingViewが提供または承認する金融、投資、取引、またはその他の種類の助言もしくは推奨であることを意図したものではなく、またこれらに該当するものでもありません。詳細は利用規約をご覧ください。
免責事項
これらの情報および投稿は、TradingViewが提供または承認する金融、投資、取引、またはその他の種類の助言もしくは推奨であることを意図したものではなく、またこれらに該当するものでもありません。詳細は利用規約をご覧ください。