ロング
BZRX/BTC
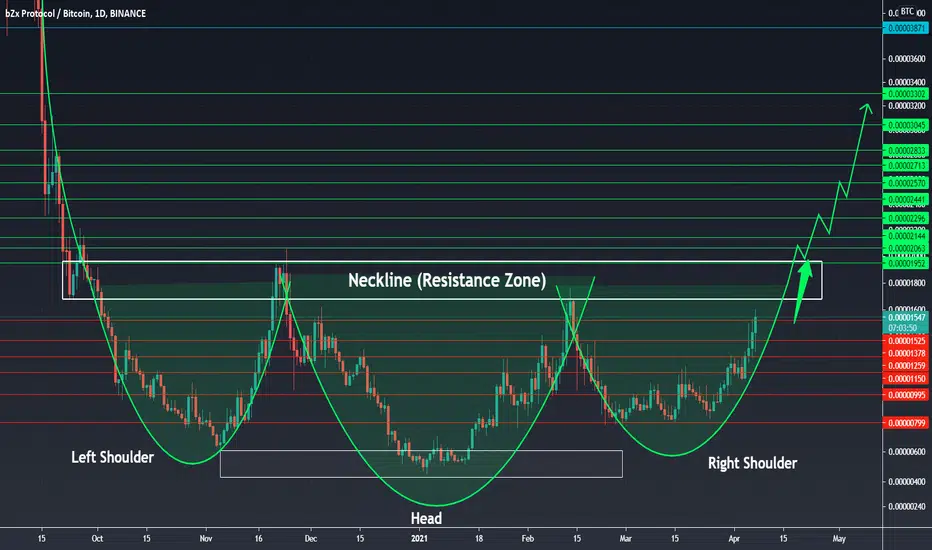
The chart says it all, bullish pattern Inverse Head & Shoulder predicts reversals in downtrend which it has been facing since the last drop in the price during Sept 2020. The final trough is being made and the price is heading upwards towards the Neckline (resistance zone) from where the BREAKOUT will start. All the targets are mentioned in green.
For educational purposes only (DYOR)
For educational purposes only (DYOR)

関連の投稿
免責事項
これらの情報および投稿は、TradingViewが提供または承認する金融、投資、取引、またはその他の種類の助言もしくは推奨であることを意図したものではなく、またこれらに該当するものでもありません。詳細は利用規約をご覧ください。
免責事項
これらの情報および投稿は、TradingViewが提供または承認する金融、投資、取引、またはその他の種類の助言もしくは推奨であることを意図したものではなく、またこれらに該当するものでもありません。詳細は利用規約をご覧ください。