

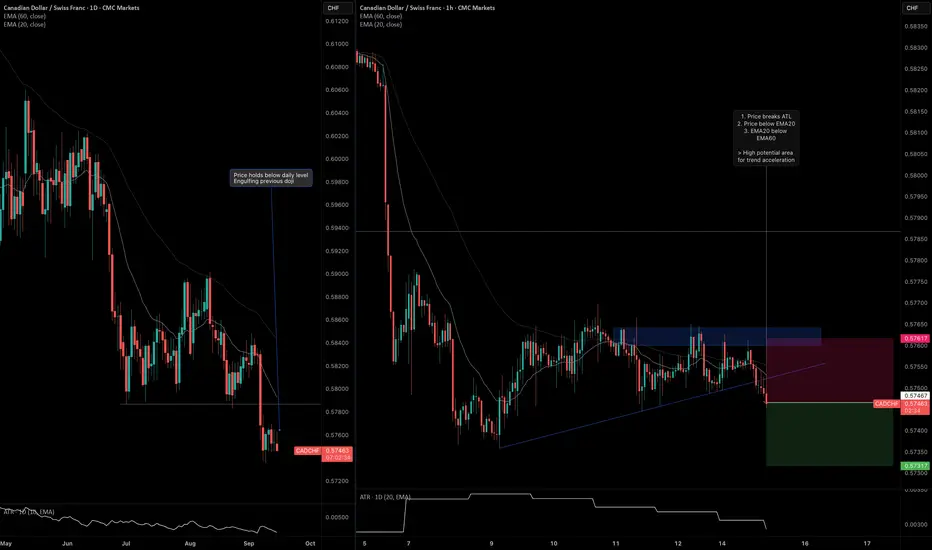
CADCHF continues to remain bearish as it holds below the key level on the daily timeframe. Here's a summary of my key observations over on the daily and intraday timeframes.
Daily Timeframe:
H1 Timeframe:
Daily Timeframe:
- Price broke the key support level in early September
- After some sideways price action, price is currently making a bearish bar that engulfs the prior day's doji
H1 Timeframe:
- Price broke through the ATL, which shows confluence with the downtrend
- EMA20 is also below EMA60, moving further apart to signal momentum is picking up
- Price is also below EMA20, which signals confluence with downtrend as well

免責事項
これらの情報および投稿は、TradingViewが提供または承認する金融、投資、取引、またはその他の種類の助言もしくは推奨であることを意図したものではなく、またこれらに該当するものでもありません。詳細は利用規約をご覧ください。
免責事項
これらの情報および投稿は、TradingViewが提供または承認する金融、投資、取引、またはその他の種類の助言もしくは推奨であることを意図したものではなく、またこれらに該当するものでもありません。詳細は利用規約をご覧ください。