

Today, we will show our view on CADCHF based on Daily and weekly timeframes.
Weekly Chart:

The price is on a major support zone, and we saw a clear rejection there. Now we can see a local trendline about to be broken, and we expect a bullish resolution towards the next resistance zone. (Descending Trendline.
Daily Chart:
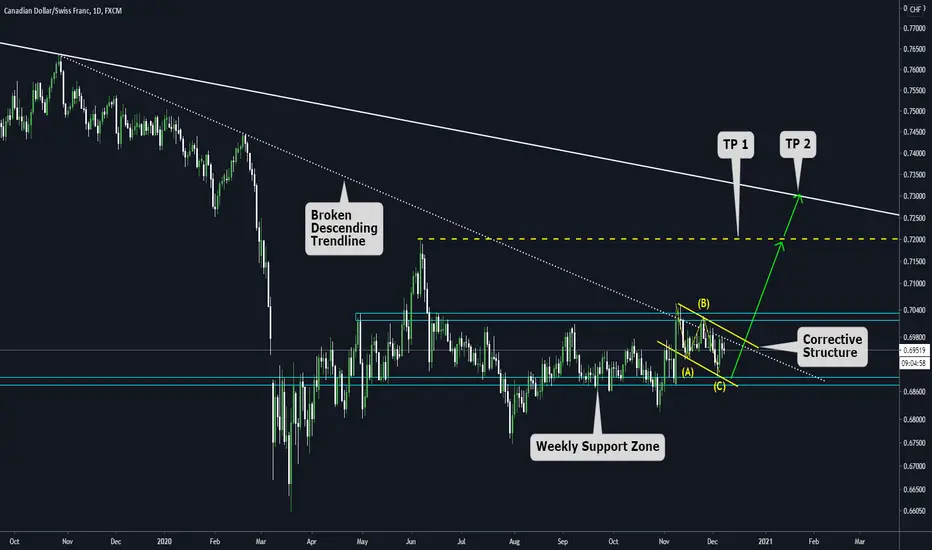
Here we have a more zoomed view of the Weekly chart, and we can see a corrective structure on the edge of the broken descending trendline. If we have a breakout of the ABC pattern, we expect a continuation movement towards the next resistance zone (TP1) and a Final Target on the Weekly descending trendline (TP2)
Weekly Chart:
The price is on a major support zone, and we saw a clear rejection there. Now we can see a local trendline about to be broken, and we expect a bullish resolution towards the next resistance zone. (Descending Trendline.
Daily Chart:
Here we have a more zoomed view of the Weekly chart, and we can see a corrective structure on the edge of the broken descending trendline. If we have a breakout of the ABC pattern, we expect a continuation movement towards the next resistance zone (TP1) and a Final Target on the Weekly descending trendline (TP2)

免責事項
これらの情報および投稿は、TradingViewが提供または承認する金融、投資、取引、またはその他の種類の助言もしくは推奨であることを意図したものではなく、またこれらに該当するものでもありません。詳細は利用規約をご覧ください。
免責事項
これらの情報および投稿は、TradingViewが提供または承認する金融、投資、取引、またはその他の種類の助言もしくは推奨であることを意図したものではなく、またこれらに該当するものでもありません。詳細は利用規約をご覧ください。