

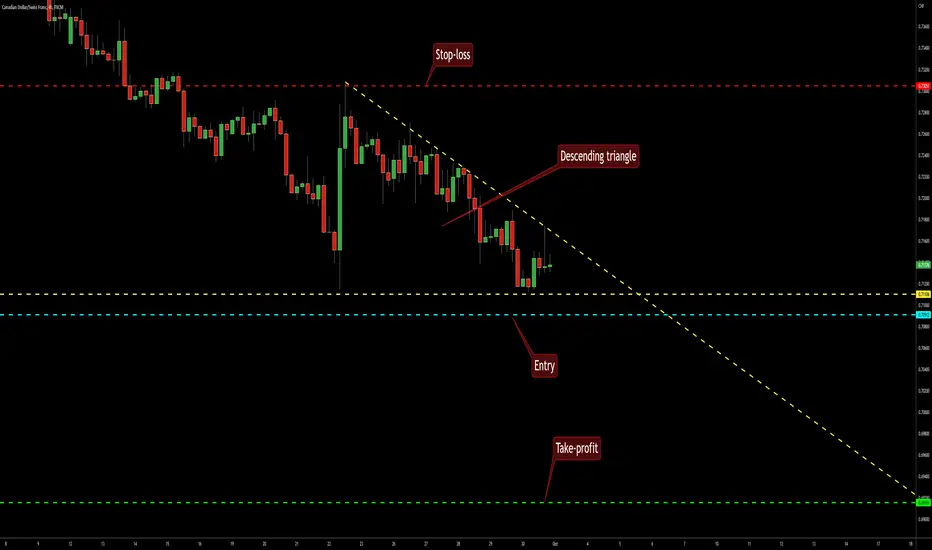
This descending triangle pattern on the 4-hour chart of the CAD/CHF currency pair offers an opportunity for a short trade in case of a bearish breakout. The triangle's borders are marked with the yellow lines. The cyan line is where my potential entry level will be. The green line denotes my take-profit level. I will set the stop-loss level to the triangle's highest point (0.73051) marked with the red line. I will ignore bullish breakouts from this trend continuation pattern.
注文をキャンセル
The trade setup has been cancelled due to the pattern's invalidation.
You can find useful tools to detect, build, and trade chart patterns - all completely free on earnforex.com.
免責事項
これらの情報および投稿は、TradingViewが提供または承認する金融、投資、取引、またはその他の種類の助言もしくは推奨であることを意図したものではなく、またこれらに該当するものでもありません。詳細は利用規約をご覧ください。
You can find useful tools to detect, build, and trade chart patterns - all completely free on earnforex.com.
免責事項
これらの情報および投稿は、TradingViewが提供または承認する金融、投資、取引、またはその他の種類の助言もしくは推奨であることを意図したものではなく、またこれらに該当するものでもありません。詳細は利用規約をご覧ください。