

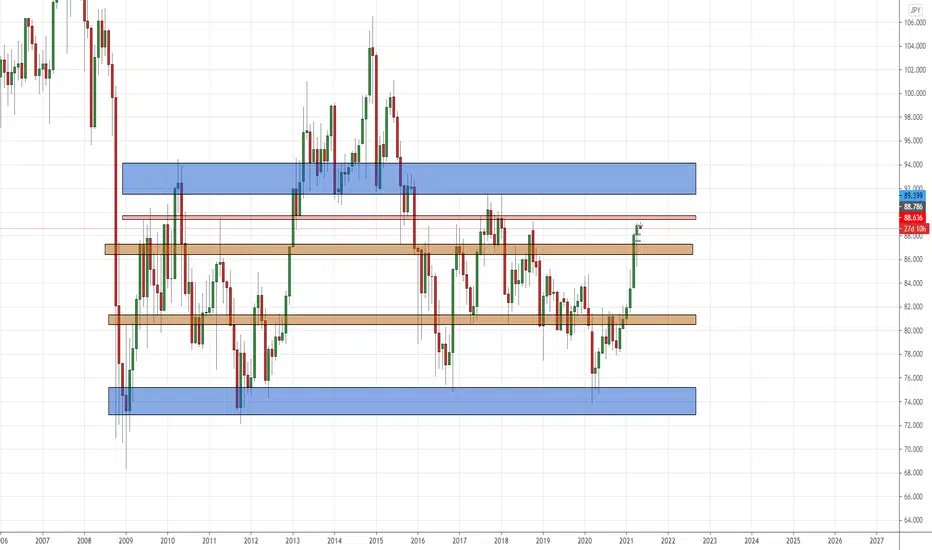
here at FXG we always place our zones before looking for technical and fundamental trades, these zones start with the monthly (blue) then weekly (yellow) and finally daily (red) then on the lower timeframe those zones we have in green. the reason for the different colours is so we know the significance of that zone. so for example if price has broken its weekly zone to the upside then chances are price is going to break its daily zone as the daily zone has less battle than the weekly zone. this gives us an edge as when we know price is making its way to a significant area of battle then we know to stay out of the trade as we want buyers or sellers to win that battle and once they do we know the direction.

免責事項
これらの情報および投稿は、TradingViewが提供または承認する金融、投資、取引、またはその他の種類の助言もしくは推奨であることを意図したものではなく、またこれらに該当するものでもありません。詳細は利用規約をご覧ください。
免責事項
これらの情報および投稿は、TradingViewが提供または承認する金融、投資、取引、またはその他の種類の助言もしくは推奨であることを意図したものではなく、またこれらに該当するものでもありません。詳細は利用規約をご覧ください。