ロング
CAE - Ascending Triangle Breakout + Re-test
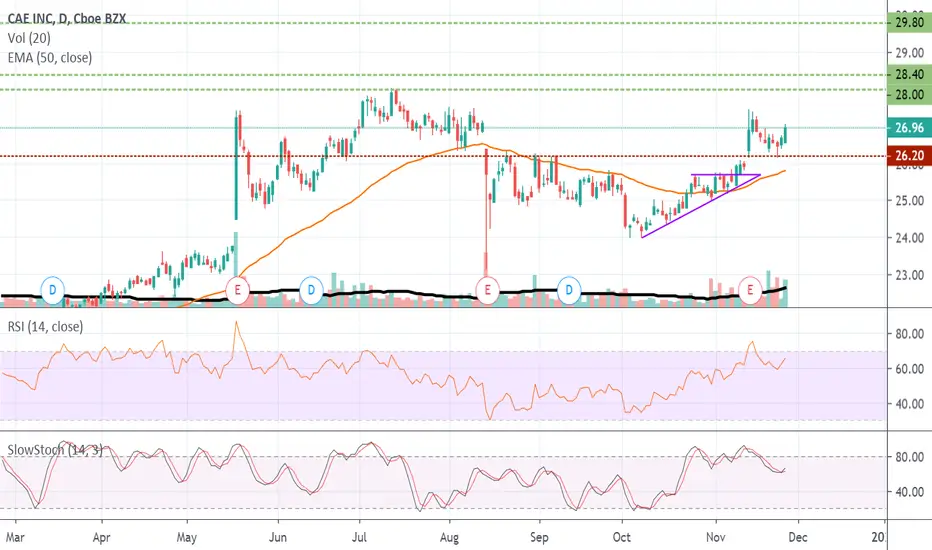
CAE broke out from an Ascending Triangle pattern on November 8th. Since then the price pulled back right to a 50% Fibonacci level where it seems to have found support & is attempting another bullish leg.
I have used the Fibonacci Extension to project three potential price targets at the 50%, 61.8%, & 100% level.
I have used the Fibonacci Extension to project three potential price targets at the 50%, 61.8%, & 100% level.

免責事項
これらの情報および投稿は、TradingViewが提供または承認する金融、投資、取引、またはその他の種類の助言もしくは推奨であることを意図したものではなく、またこれらに該当するものでもありません。詳細は利用規約をご覧ください。
免責事項
これらの情報および投稿は、TradingViewが提供または承認する金融、投資、取引、またはその他の種類の助言もしくは推奨であることを意図したものではなく、またこれらに該当するものでもありません。詳細は利用規約をご覧ください。