
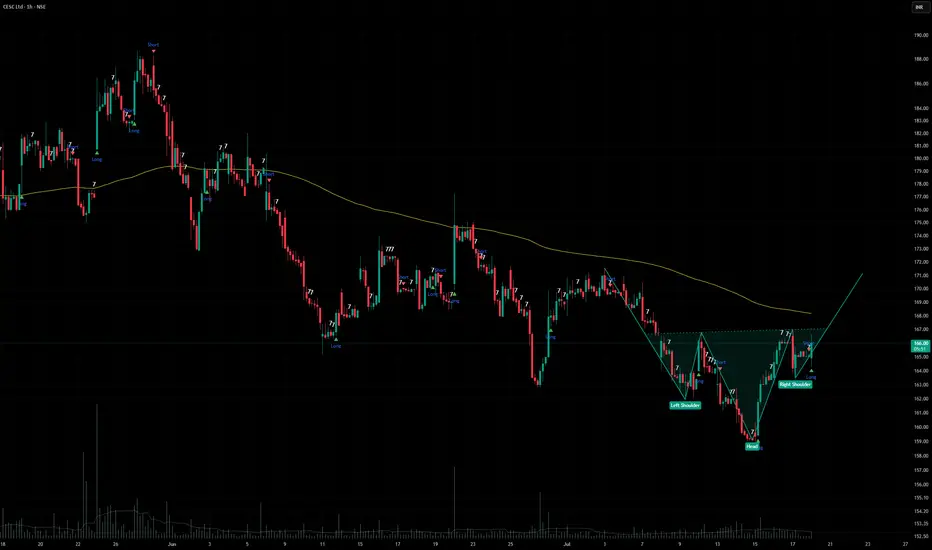
CESC Ltd – Head & Shoulders Reversal Watch
Setup: 1‑hour chart showing a Head & Shoulders formation with neckline in play.
Current Price Zone: ₹158 – ₹190.
Trend Context:
Left Shoulder, Head, Right Shoulder clearly defined.
Moving average providing dynamic support.
Long/Short signals marking trader interest.
Why Traders Care:
Head & Shoulders is a classic reversal pattern.
Break below neckline often signals bearish momentum.
Volume spikes add conviction to whichever side confirms.
My Take: CESC Ltd is flashing a potential reversal — sustaining below neckline could trigger downside, while holding above may invalidate the setup.
Setup: 1‑hour chart showing a Head & Shoulders formation with neckline in play.
Current Price Zone: ₹158 – ₹190.
Trend Context:
Left Shoulder, Head, Right Shoulder clearly defined.
Moving average providing dynamic support.
Long/Short signals marking trader interest.
Why Traders Care:
Head & Shoulders is a classic reversal pattern.
Break below neckline often signals bearish momentum.
Volume spikes add conviction to whichever side confirms.
My Take: CESC Ltd is flashing a potential reversal — sustaining below neckline could trigger downside, while holding above may invalidate the setup.

Sucrit.D.Patil
免責事項
これらの情報および投稿は、TradingViewが提供または承認する金融、投資、取引、またはその他の種類の助言もしくは推奨であることを意図したものではなく、またこれらに該当するものでもありません。詳細は利用規約をご覧ください。
Sucrit.D.Patil
免責事項
これらの情報および投稿は、TradingViewが提供または承認する金融、投資、取引、またはその他の種類の助言もしくは推奨であることを意図したものではなく、またこれらに該当するものでもありません。詳細は利用規約をご覧ください。