
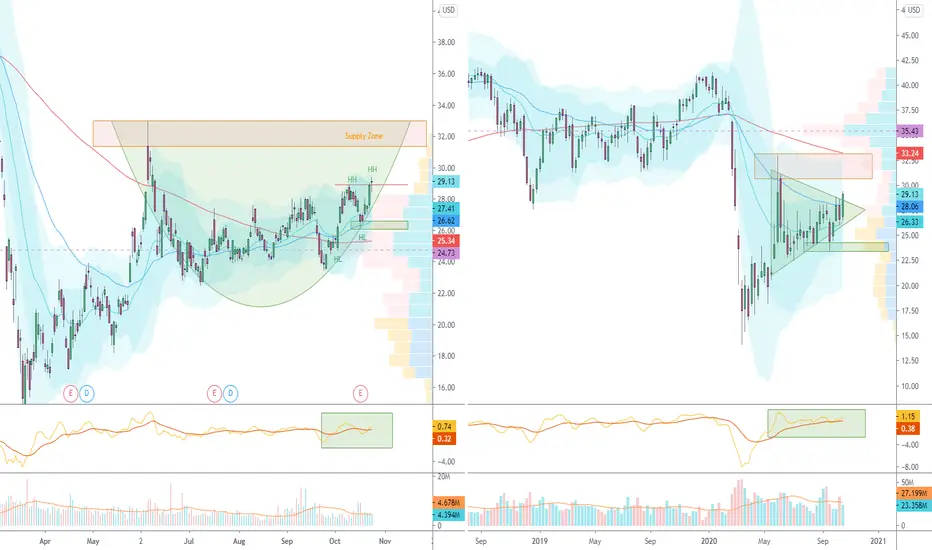
#CFG Daily and Weekly Charts. It is creating higher lows and higher highs for a while absorbing the major supplies and forming a rounded bottom pattern. It is sitting above all the major moving averages denoting a strong uptrend is forming. The next supply zone is around 32 levels and we may see some reaction and a higher low before reaching the supply zone. We need to see how it reacts to the supply zone.
In the weekly chart, it made a breakout from a symmetrical triangle which confirms the daily chart pattern.
In the weekly chart, it made a breakout from a symmetrical triangle which confirms the daily chart pattern.
トレード稼働中
Made a strong breakout. Now at the supply zone.
免責事項
これらの情報および投稿は、TradingViewが提供または承認する金融、投資、取引、またはその他の種類の助言もしくは推奨であることを意図したものではなく、またこれらに該当するものでもありません。詳細は利用規約をご覧ください。
免責事項
これらの情報および投稿は、TradingViewが提供または承認する金融、投資、取引、またはその他の種類の助言もしくは推奨であることを意図したものではなく、またこれらに該当するものでもありません。詳細は利用規約をご覧ください。