
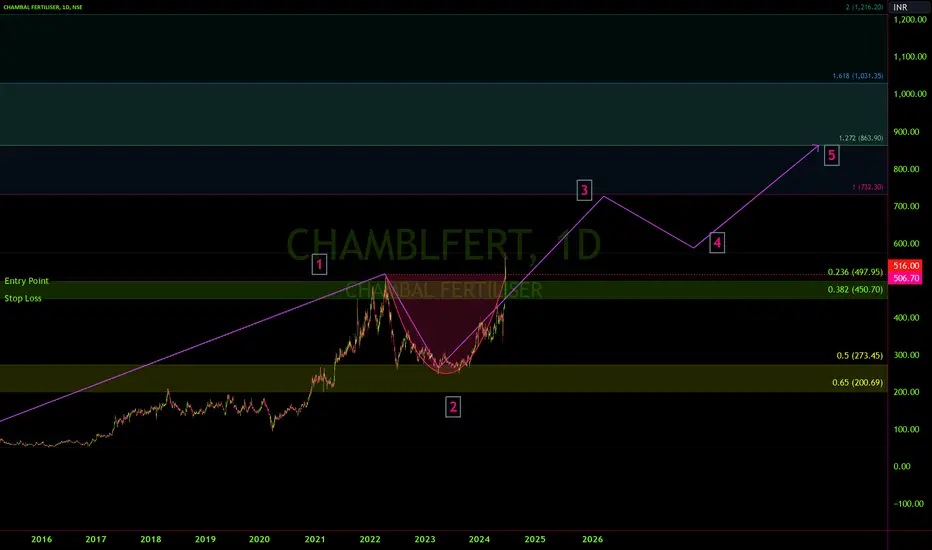
CHAMBAL Fertiliser on a daily time frame
CUP chart pattern
Monthly and Weekly RSI above 60 levels
Daily, 75 mins and 15 mins RSI declining
It should retrace the neckline levels to retest the levels.
If you calculate the retracement, it should retrace between 23.6 to 38.2%.
You can notice unusual volume on a break-out candle.
CUP chart pattern
Monthly and Weekly RSI above 60 levels
Daily, 75 mins and 15 mins RSI declining
It should retrace the neckline levels to retest the levels.
If you calculate the retracement, it should retrace between 23.6 to 38.2%.
You can notice unusual volume on a break-out candle.

免責事項
これらの情報および投稿は、TradingViewが提供または承認する金融、投資、取引、またはその他の種類の助言もしくは推奨であることを意図したものではなく、またこれらに該当するものでもありません。詳細は利用規約をご覧ください。
免責事項
これらの情報および投稿は、TradingViewが提供または承認する金融、投資、取引、またはその他の種類の助言もしくは推奨であることを意図したものではなく、またこれらに該当するものでもありません。詳細は利用規約をご覧ください。