

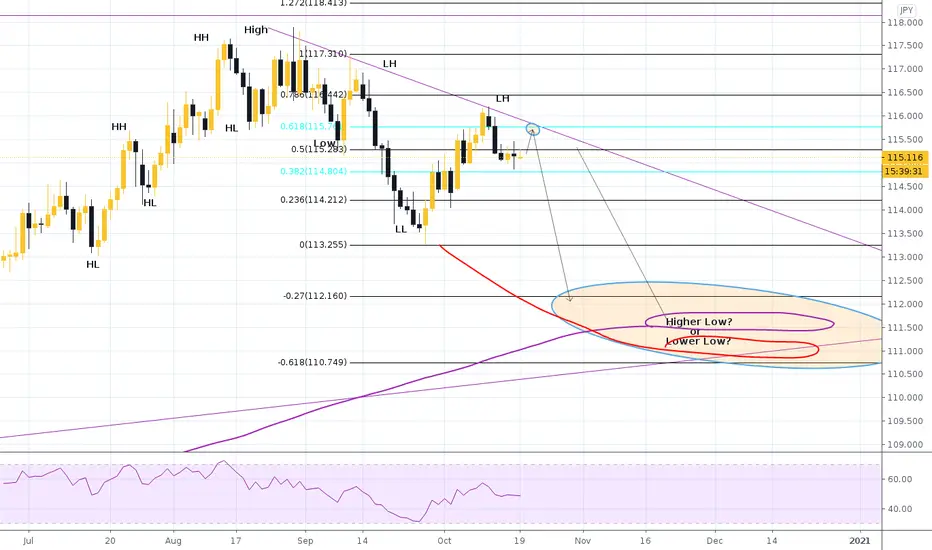
Price appeared to have broken the low during the previous month. This monthly candle appears to be a retracement or a retest of that level. So far it a look as if price will respect that level and may be signaling it's setting up to make a large push to the downside.
The weekly time frame show a double top, with a retest to the neckline, price also met resistance at and respected the trend line creating a lower high.
Expecting a price to retrace/test and respect the 61.8 fib level on the daily, then creating a bearish impulse/continuation.
I'm expecting price to sell off into the lower eclipse, possibly to the lower trend line and respect it, creating a lower low of the bearish trend, while simultaneously creating a higher low in the bigger picture. (this explains the purple and red drawings)
Feel free to like, or comment and post your analysis if you see something different!!
The weekly time frame show a double top, with a retest to the neckline, price also met resistance at and respected the trend line creating a lower high.
Expecting a price to retrace/test and respect the 61.8 fib level on the daily, then creating a bearish impulse/continuation.
I'm expecting price to sell off into the lower eclipse, possibly to the lower trend line and respect it, creating a lower low of the bearish trend, while simultaneously creating a higher low in the bigger picture. (this explains the purple and red drawings)
Feel free to like, or comment and post your analysis if you see something different!!

免責事項
これらの情報および投稿は、TradingViewが提供または承認する金融、投資、取引、またはその他の種類の助言もしくは推奨であることを意図したものではなく、またこれらに該当するものでもありません。詳細は利用規約をご覧ください。
免責事項
これらの情報および投稿は、TradingViewが提供または承認する金融、投資、取引、またはその他の種類の助言もしくは推奨であることを意図したものではなく、またこれらに該当するものでもありません。詳細は利用規約をご覧ください。