更新済
CHK - Overview
Good evening everyone,
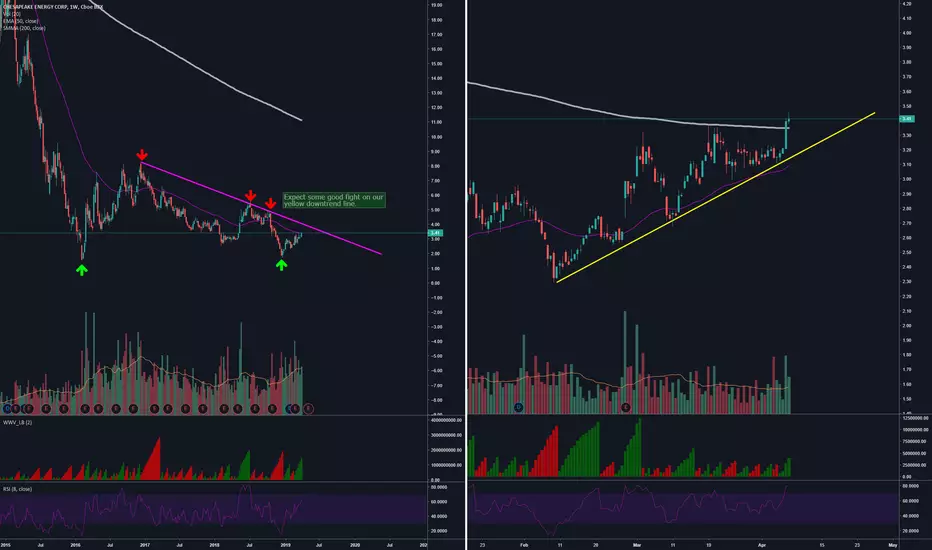
CHK is being on a huge downtrend for some years already, pretty much since 2014, the question is, how deep a stock can go?
The answer is, 0, of course, but what about new ATH's ? the answer is, infinite and beyond =)
This stock just rejected again the 1.80 support level from FEB/16 and now its being on a slighty uptrend (H4 chart).
If we see the last weekly candle closure, it closed RIGHT on our 50 ema which may work as resistance (monday open will tell us) and above H4 200 sma level, what concerns me was the next candle.
Almost the same volume as the previous one but too little progress, exhaustion ?
I expect price to return to yellow uptrend (H4 chart) and then go test our big weekly downtrend (pink line), shall price reject the weekly downtrend then we can try short this stock to current 1.80usd bottom level.
This Trading Idea is to be used for educational purposes only. This idea does not represent financial advice and its NOT a signal. You should trade based only on your own technic and knowledge.
CHK is being on a huge downtrend for some years already, pretty much since 2014, the question is, how deep a stock can go?
The answer is, 0, of course, but what about new ATH's ? the answer is, infinite and beyond =)
This stock just rejected again the 1.80 support level from FEB/16 and now its being on a slighty uptrend (H4 chart).
If we see the last weekly candle closure, it closed RIGHT on our 50 ema which may work as resistance (monday open will tell us) and above H4 200 sma level, what concerns me was the next candle.
Almost the same volume as the previous one but too little progress, exhaustion ?
I expect price to return to yellow uptrend (H4 chart) and then go test our big weekly downtrend (pink line), shall price reject the weekly downtrend then we can try short this stock to current 1.80usd bottom level.
This Trading Idea is to be used for educational purposes only. This idea does not represent financial advice and its NOT a signal. You should trade based only on your own technic and knowledge.
ノート
Uptrend is broken , but it was too much volumeStanding on support zone right now, i wouldn't rush to short this one, not yet

免責事項
これらの情報および投稿は、TradingViewが提供または承認する金融、投資、取引、またはその他の種類の助言もしくは推奨であることを意図したものではなく、またこれらに該当するものでもありません。詳細は利用規約をご覧ください。
免責事項
これらの情報および投稿は、TradingViewが提供または承認する金融、投資、取引、またはその他の種類の助言もしくは推奨であることを意図したものではなく、またこれらに該当するものでもありません。詳細は利用規約をご覧ください。