
Hello Crypto Lovers,
Mars Signals team wishes you high profits.
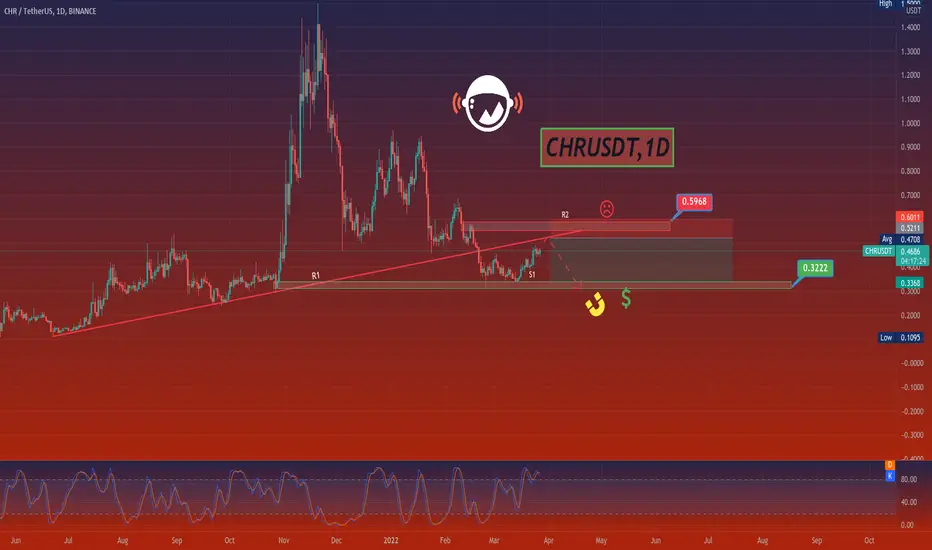
Looking at CHR/USDT in a daily time frame, we can recognise that the price lost its previous support, transforming it into a resistance area which we identified as a red line. Yet the support area we already detected and highlighted in green is expected to act as a pullback zone, inducing a recovery for which we consider an end after a new collision whith the resistance line marked above. This scenario would lead to another fall. Furthermore we take the opposite case into account in which the price could make its way through the first as well as the second resistance line, giving us a signal for a further rise.
Warning: This is just a suggestion and we do not guarantee profits. We advise you analyze the chart before opening any position.
Wish you luck
Mars Signals team wishes you high profits.
Looking at CHR/USDT in a daily time frame, we can recognise that the price lost its previous support, transforming it into a resistance area which we identified as a red line. Yet the support area we already detected and highlighted in green is expected to act as a pullback zone, inducing a recovery for which we consider an end after a new collision whith the resistance line marked above. This scenario would lead to another fall. Furthermore we take the opposite case into account in which the price could make its way through the first as well as the second resistance line, giving us a signal for a further rise.
Warning: This is just a suggestion and we do not guarantee profits. We advise you analyze the chart before opening any position.
Wish you luck

免責事項
これらの情報および投稿は、TradingViewが提供または承認する金融、投資、取引、またはその他の種類の助言もしくは推奨であることを意図したものではなく、またこれらに該当するものでもありません。詳細は利用規約をご覧ください。
免責事項
これらの情報および投稿は、TradingViewが提供または承認する金融、投資、取引、またはその他の種類の助言もしくは推奨であることを意図したものではなく、またこれらに該当するものでもありません。詳細は利用規約をご覧ください。