
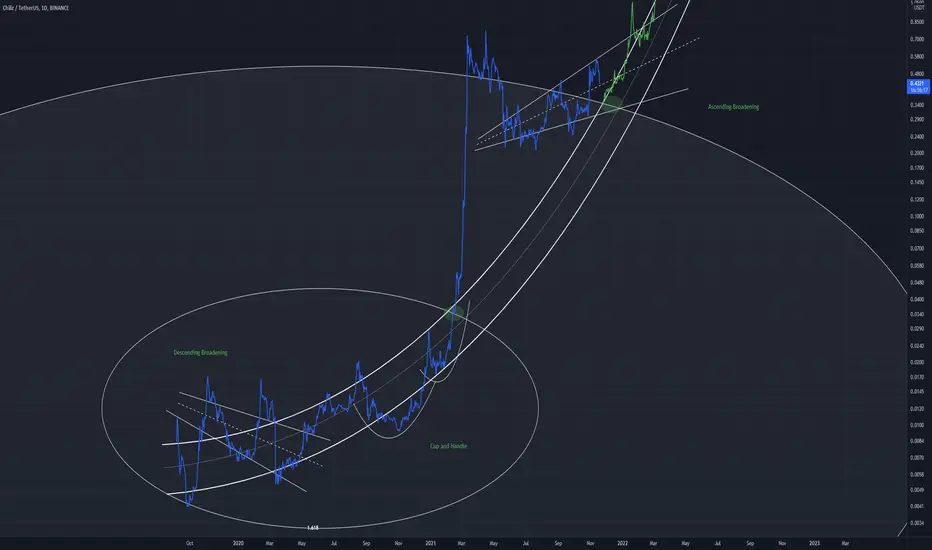
CHZ has performed a moonshot and is now sitting above the 4.618 fib level
This is due to the breakout of the curved structure that is present
Patterns that have formed on the chart include falling wedges and broadening wedges, both ascending and descending, and a cup and handle.
You could assume that because the descending one broke out bullishly the ascending one will be bearish. This is not certainly the case. probability dictates which way the wedge will break to.
While price is sitting above 4.618 ill assume the bullish movement hasn't stopped, and movement along the curve may peak soon.
This is due to the breakout of the curved structure that is present
Patterns that have formed on the chart include falling wedges and broadening wedges, both ascending and descending, and a cup and handle.
You could assume that because the descending one broke out bullishly the ascending one will be bearish. This is not certainly the case. probability dictates which way the wedge will break to.
While price is sitting above 4.618 ill assume the bullish movement hasn't stopped, and movement along the curve may peak soon.

免責事項
これらの情報および投稿は、TradingViewが提供または承認する金融、投資、取引、またはその他の種類の助言もしくは推奨であることを意図したものではなく、またこれらに該当するものでもありません。詳細は利用規約をご覧ください。
免責事項
これらの情報および投稿は、TradingViewが提供または承認する金融、投資、取引、またはその他の種類の助言もしくは推奨であることを意図したものではなく、またこれらに該当するものでもありません。詳細は利用規約をご覧ください。