
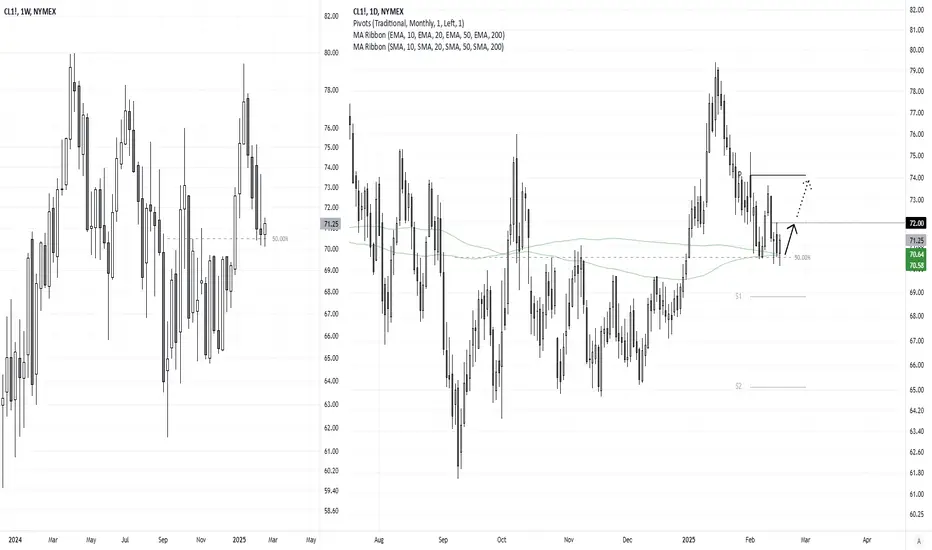
This is a bit of a scrappy chart, but I still see the potential for a cheeky bounce.
WTI crude oil is trying to snap a 4-week losing streak, by stalling around a 50% retracement level. Last week's candle was an inverted hammer, and the previous two weeks have both closed above the 50% level.
A bullish divergence formed on the daily RSI (2) ahead price action finding support at the 200-day SMA and 200-day EMA.
From here, the bias remains bullish while prices hold above last week's low. Bulls could seek dips towards the 200-day MAs, with a near-term upside target of $72. A break above which brings $74 into focus, near the monthly pivot point.
Matt Simpson, Market Analyst at City Index and Forex.com
WTI crude oil is trying to snap a 4-week losing streak, by stalling around a 50% retracement level. Last week's candle was an inverted hammer, and the previous two weeks have both closed above the 50% level.
A bullish divergence formed on the daily RSI (2) ahead price action finding support at the 200-day SMA and 200-day EMA.
From here, the bias remains bullish while prices hold above last week's low. Bulls could seek dips towards the 200-day MAs, with a near-term upside target of $72. A break above which brings $74 into focus, near the monthly pivot point.
Matt Simpson, Market Analyst at City Index and Forex.com
トレード終了: 利益確定目標に到達

関連の投稿
免責事項
これらの情報および投稿は、TradingViewが提供または承認する金融、投資、取引、またはその他の種類の助言もしくは推奨であることを意図したものではなく、またこれらに該当するものでもありません。詳細は利用規約をご覧ください。
関連の投稿
免責事項
これらの情報および投稿は、TradingViewが提供または承認する金融、投資、取引、またはその他の種類の助言もしくは推奨であることを意図したものではなく、またこれらに該当するものでもありません。詳細は利用規約をご覧ください。