
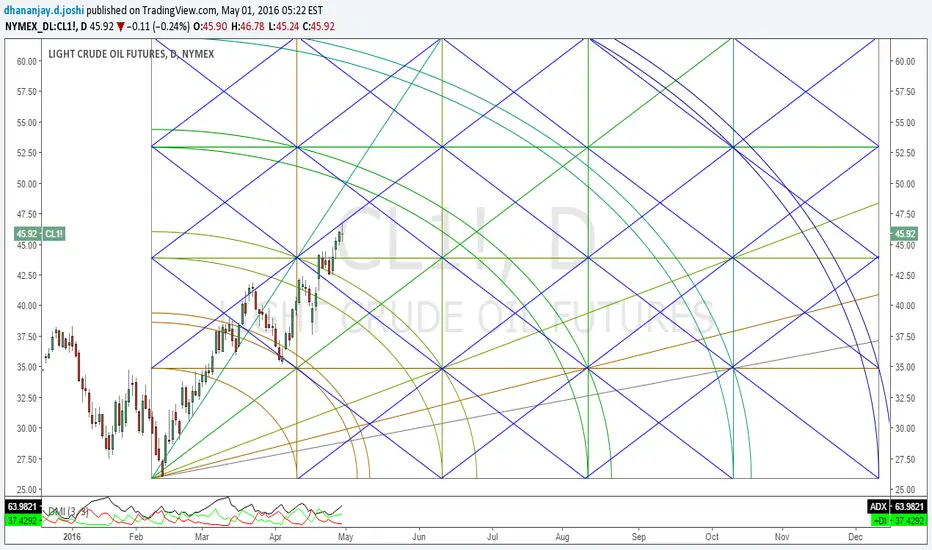
Every line on the chart represents support or resistance.
Vertical lines are time lines where trend may change.
One can use this chart as trading map for next few months. This Gann square-3.00% chart can be used in standalone way or with other trading strategies like. Candle stick patterns, demand supply zones, Momentum indicators, Fibonacci ratios, trend channels or any other way of your own. This chart can be considered as trade conformation chart.
With all kind of tools and charts we are trying to analyse where trend will change, with this or with my any other chart my intention is not to judge top or bottom. With all the tools we will always try to find possible entry exit and stops only.
It is helpful in deciding entry exit and stops.

関連の投稿
免責事項
これらの情報および投稿は、TradingViewが提供または承認する金融、投資、取引、またはその他の種類の助言もしくは推奨であることを意図したものではなく、またこれらに該当するものでもありません。詳細は利用規約をご覧ください。
関連の投稿
免責事項
これらの情報および投稿は、TradingViewが提供または承認する金融、投資、取引、またはその他の種類の助言もしくは推奨であることを意図したものではなく、またこれらに該当するものでもありません。詳細は利用規約をご覧ください。