
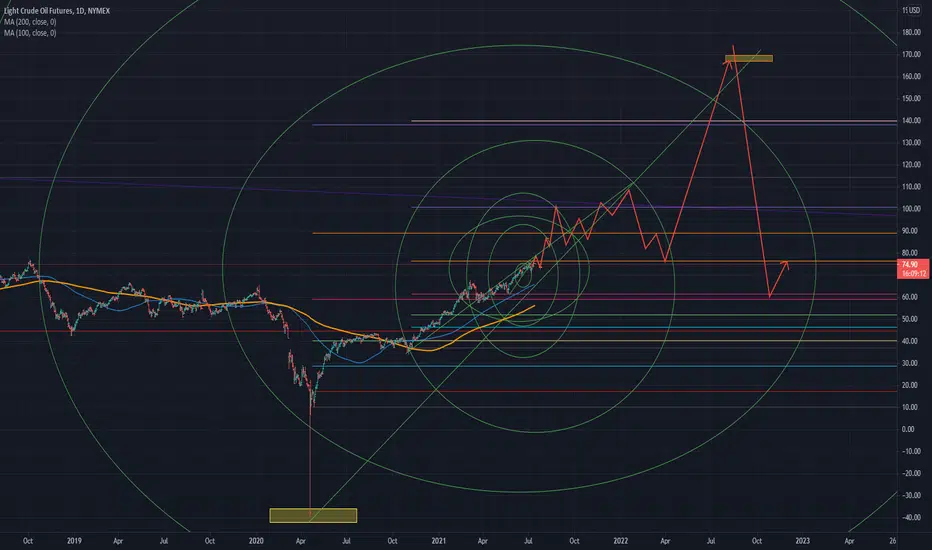
I used Fibonacci circles and used extensions. It is a prediction chart using wave properties. According to this chart, after hitting the $100 range in September of this year and falling, it rises again to $100 in early 2022, and then renews the highest price in 2022 after the decline.
Remember, this is just a personal scenario, not an exact calculation. The choice is yours
Remember, this is just a personal scenario, not an exact calculation. The choice is yours

免責事項
これらの情報および投稿は、TradingViewが提供または承認する金融、投資、取引、またはその他の種類の助言もしくは推奨であることを意図したものではなく、またこれらに該当するものでもありません。詳細は利用規約をご覧ください。
免責事項
これらの情報および投稿は、TradingViewが提供または承認する金融、投資、取引、またはその他の種類の助言もしくは推奨であることを意図したものではなく、またこれらに該当するものでもありません。詳細は利用規約をご覧ください。