
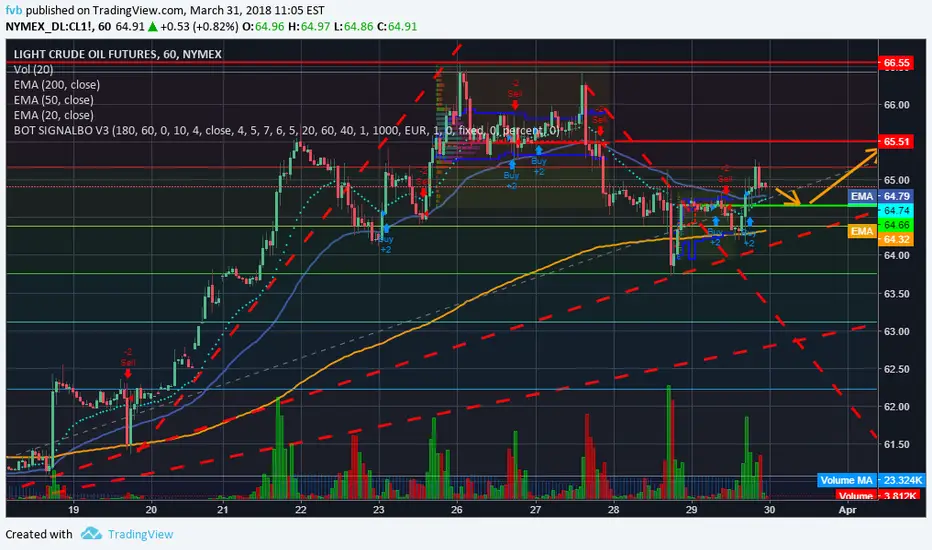
This week, oil failed to overcome resistance at a price of 66.55 (January). The EMA 50 was pierced, followed by a rebound from the EMA 200. The nearest resistance is 65.51, in case of not overcoming this level, the pattern is possible: a double top with a signal for a short position. Nearest support 64.66.
In the near future, more likely to retest the resistance level of 65.51, which is confirmed by EMA 20 and EMA 50.
Our trading robot is also aimed at a long position
I do not recommend entering into a deal or making conclusions on Monday, at the beginning of the week there is a set of positions of large companies.
All good trades

免責事項
これらの情報および投稿は、TradingViewが提供または承認する金融、投資、取引、またはその他の種類の助言もしくは推奨であることを意図したものではなく、またこれらに該当するものでもありません。詳細は利用規約をご覧ください。
免責事項
これらの情報および投稿は、TradingViewが提供または承認する金融、投資、取引、またはその他の種類の助言もしくは推奨であることを意図したものではなく、またこれらに該当するものでもありません。詳細は利用規約をご覧ください。