🛢️ Crude Oil: Bearish $63 Target vs. Bullish $117 Scenario
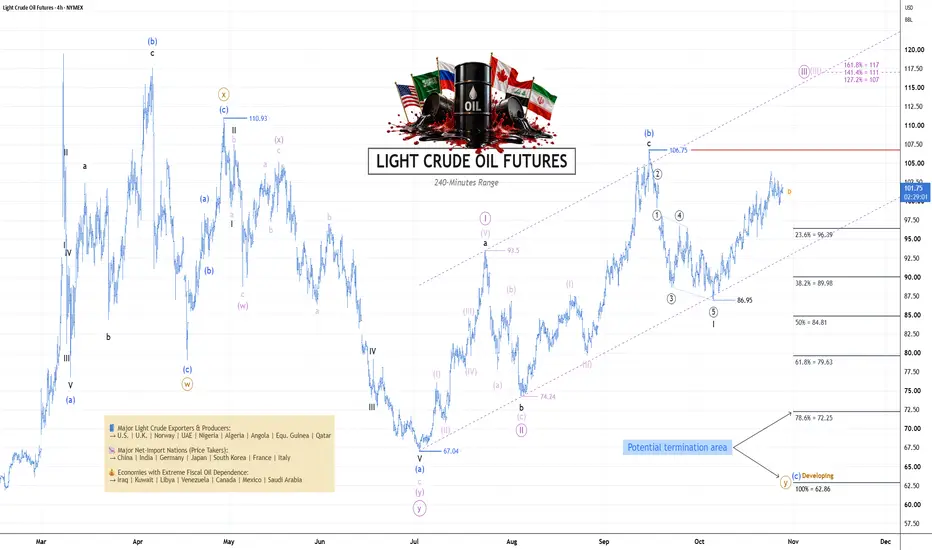
 CL1! is approaching a critical decision point. The current chart presents two possible paths: a developing bearish correction with a potential target near $62.86, or a bullish breakout that could open the way toward $117.
A decisive move above or below $106.75 will help determine which scenario takes priority.
🔵 Scenario 1: Bearish W–X–Y Correction
The larger corrective structure may be developing as a double zigzag:
Within wave Y, the decline from $106.75 to $86.95 may form a five-wave impulse, potentially completing wave I. The subsequent recovery may represent wave II, while wave (c) of Y could still be developing.
🎯 Key Price Targets: From $96.39
🟣 Scenario 2: Bullish Impulse
The alternative count treats the advance from $67.04 as the beginning of a new bullish impulse.
A decisive break above $106.75 would invalidate the bearish wave I–II interpretation shown on the right side of the chart and strengthen the bullish alternative. The internal wave structure would still need to support the bullish count.
🔑 The Key Level: $106.75
This is the critical decision level. Below $106.75, the bearish scenario remains viable. A decisive break above it would shift attention toward the bullish projections.
💬 Which Count Do You Favor?
A developing wave (c) toward $62.86, or a potential bullish wave III toward $117?
Share your interpretation in the comments.
CL1! is approaching a critical decision point. The current chart presents two possible paths: a developing bearish correction with a potential target near $62.86, or a bullish breakout that could open the way toward $117.A decisive move above or below $106.75 will help determine which scenario takes priority.
🔵 Scenario 1: Bearish W–X–Y Correction
The larger corrective structure may be developing as a double zigzag:
- Wave W: The initial decline.
- Wave X: The corrective recovery, terminating near $110.93.
- Wave Y: A potential second zigzag, with wave (a) ending at $67.04 and wave (b) ending at $106.75.
Within wave Y, the decline from $106.75 to $86.95 may form a five-wave impulse, potentially completing wave I. The subsequent recovery may represent wave II, while wave (c) of Y could still be developing.
🎯 Key Price Targets: From $96.39
- Day traders: $89.98–$86.95
- Short-term traders: $84.81–$79.63
- Long-term outlook: $72.25–$62.86
🟣 Scenario 2: Bullish Impulse
The alternative count treats the advance from $67.04 as the beginning of a new bullish impulse.
- Wave I: A potential five-wave advance from $67.04 to approximately $93.50.
- Wave II: A corrective pullback toward $74.24.
- Wave III: Potentially developing, with fib extension targets near $108, $112, and $117.
A decisive break above $106.75 would invalidate the bearish wave I–II interpretation shown on the right side of the chart and strengthen the bullish alternative. The internal wave structure would still need to support the bullish count.
🔑 The Key Level: $106.75
This is the critical decision level. Below $106.75, the bearish scenario remains viable. A decisive break above it would shift attention toward the bullish projections.
💬 Which Count Do You Favor?
A developing wave (c) toward $62.86, or a potential bullish wave III toward $117?
Share your interpretation in the comments.

関連の投稿
免責事項
これらの情報および投稿は、TradingViewが提供または承認する金融、投資、取引、またはその他の種類の助言もしくは推奨であることを意図したものではなく、またこれらに該当するものでもありません。詳細は利用規約をご覧ください。
関連の投稿
免責事項
これらの情報および投稿は、TradingViewが提供または承認する金融、投資、取引、またはその他の種類の助言もしくは推奨であることを意図したものではなく、またこれらに該当するものでもありません。詳細は利用規約をご覧ください。