
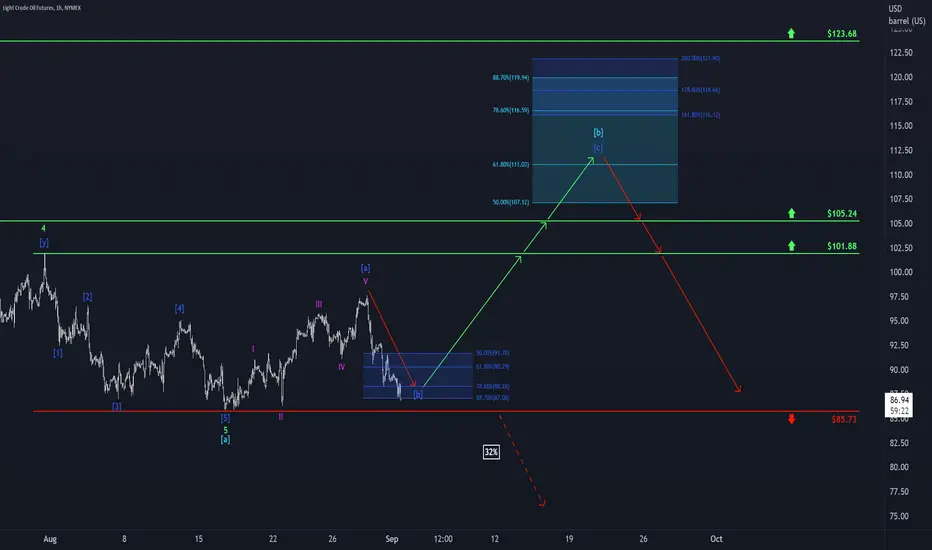
Can you hear WTI’s brakes screeching from the chart? Well, we definitely can! Quite vehemently, WTI has hit the brakes just short of the bottom of the blue zone between $91.70 and $87.08 – and rightly so! There isn’t all that much room left to finish wave b in blue! In fact, WTI should complete it no later than the support at $85.73. Then, it should turn around and climb upwards, gradually crossing the resistances at $101.88 and at $105.24 to enter the turquoise zone between $107.12 and $119.94. There, it should finish wave b in turquoise, before moving downwards again. However, there is a 32% chance that WTI could drop below the support at $85.73, which would then trigger further descent.

📊 Daily market insights combining macro + Elliott Wave analysis
🚀 Spot trends early with momentum, sentiment & price structure
🌐 Join thousands trading smarter at hkcmglobal.com
🚀 Spot trends early with momentum, sentiment & price structure
🌐 Join thousands trading smarter at hkcmglobal.com
関連の投稿
免責事項
これらの情報および投稿は、TradingViewが提供または承認する金融、投資、取引、またはその他の種類の助言もしくは推奨であることを意図したものではなく、またこれらに該当するものでもありません。詳細は利用規約をご覧ください。
📊 Daily market insights combining macro + Elliott Wave analysis
🚀 Spot trends early with momentum, sentiment & price structure
🌐 Join thousands trading smarter at hkcmglobal.com
🚀 Spot trends early with momentum, sentiment & price structure
🌐 Join thousands trading smarter at hkcmglobal.com
関連の投稿
免責事項
これらの情報および投稿は、TradingViewが提供または承認する金融、投資、取引、またはその他の種類の助言もしくは推奨であることを意図したものではなく、またこれらに該当するものでもありません。詳細は利用規約をご覧ください。