
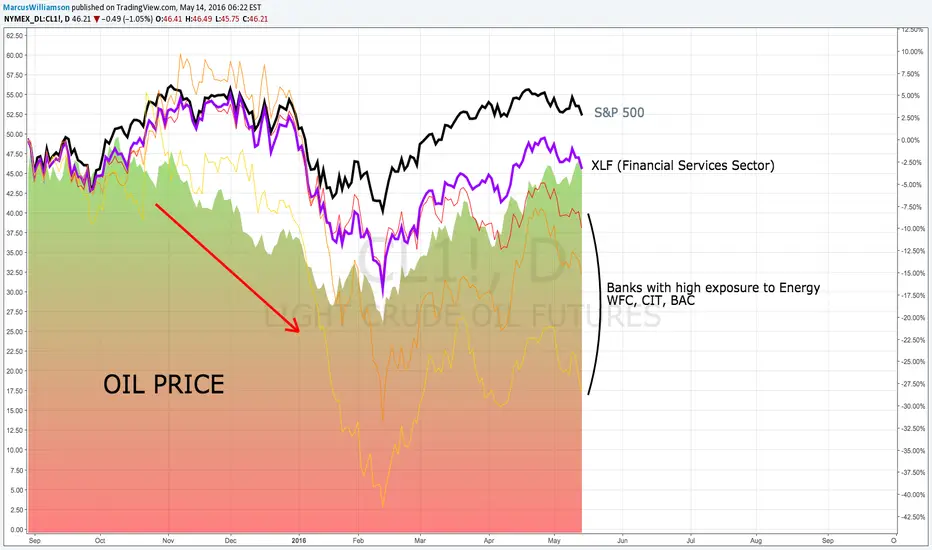
Oil price recovery has been mostly driven by USD related factors and so the fundamentals are still not where they need to be and the chronic oversupply continues. The banks with the largest energy debt exposure have felt the squeeze as a result and remain relatively risky.
This chart shows the performance of the banks with the largest declared Energy debt exposure in the US vs the XLF ETF and wider S&P 500 Index, the backdrop is the Oil price.
This chart shows the performance of the banks with the largest declared Energy debt exposure in the US vs the XLF ETF and wider S&P 500 Index, the backdrop is the Oil price.

免責事項
これらの情報および投稿は、TradingViewが提供または承認する金融、投資、取引、またはその他の種類の助言もしくは推奨であることを意図したものではなく、またこれらに該当するものでもありません。詳細は利用規約をご覧ください。
免責事項
これらの情報および投稿は、TradingViewが提供または承認する金融、投資、取引、またはその他の種類の助言もしくは推奨であることを意図したものではなく、またこれらに該当するものでもありません。詳細は利用規約をご覧ください。