
Chart Structure & Market Context
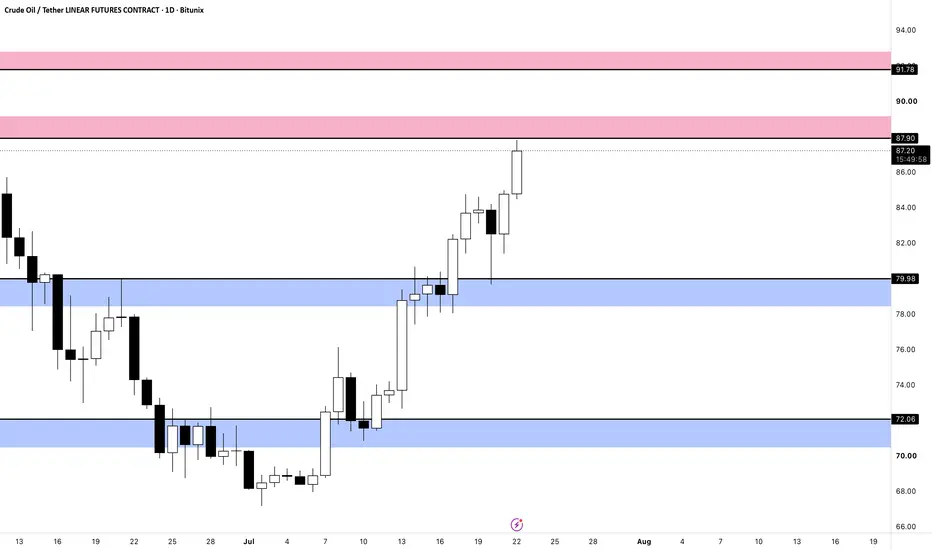
Current Price Action: The chart shows a strong impulse recovery following a sharp multi-week downtrend that bottomed out near the 67-68 support region in early July. Price is currently pushing higher, trading around $86.83, breaking out of its previous consolidation range.
Key Support Zones (Blue Bands):
Lower major support sits around $72.06, where the market established a solid swing base.
Intermediate support/retest zone lies around $79.98, which previously acted as resistance before being flipped into support during the breakout.
Key Resistance Zones (Pink Bands):
Immediate overhead resistance is stacked between $87.90 and $91.78, aligning with prior structural supply where the previous major downtrend originated.
Technical Outlook
Momentum:
The sequence of higher lows and strong bullish daily candles indicates that the short-term path of least resistance has flipped firmly to the upside.
The Test Ahead:
Price is now pressing directly into the lower boundary of the upper resistance zone (~$87.90). How price reacts here will determine whether it can carve a path toward the upper bound of $91.78 or if it will experience a localised pull-back/consolidation to digest recent gains.
Current Price Action: The chart shows a strong impulse recovery following a sharp multi-week downtrend that bottomed out near the 67-68 support region in early July. Price is currently pushing higher, trading around $86.83, breaking out of its previous consolidation range.
Key Support Zones (Blue Bands):
Lower major support sits around $72.06, where the market established a solid swing base.
Intermediate support/retest zone lies around $79.98, which previously acted as resistance before being flipped into support during the breakout.
Key Resistance Zones (Pink Bands):
Immediate overhead resistance is stacked between $87.90 and $91.78, aligning with prior structural supply where the previous major downtrend originated.
Technical Outlook
Momentum:
The sequence of higher lows and strong bullish daily candles indicates that the short-term path of least resistance has flipped firmly to the upside.
The Test Ahead:
Price is now pressing directly into the lower boundary of the upper resistance zone (~$87.90). How price reacts here will determine whether it can carve a path toward the upper bound of $91.78 or if it will experience a localised pull-back/consolidation to digest recent gains.

免責事項
これらの情報および投稿は、TradingViewが提供または承認する金融、投資、取引、またはその他の種類の助言もしくは推奨であることを意図したものではなく、またこれらに該当するものでもありません。詳細は利用規約をご覧ください。
免責事項
これらの情報および投稿は、TradingViewが提供または承認する金融、投資、取引、またはその他の種類の助言もしくは推奨であることを意図したものではなく、またこれらに該当するものでもありません。詳細は利用規約をご覧ください。