
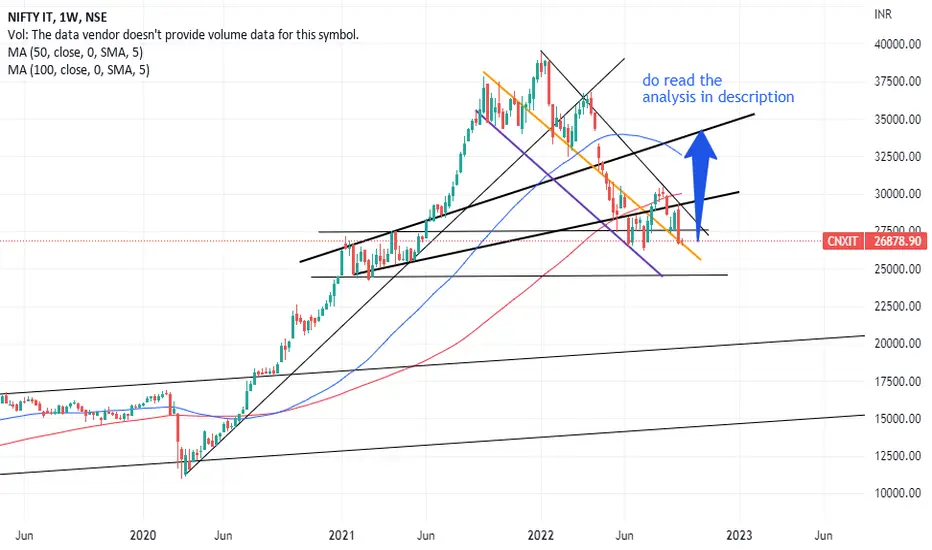
the dark purple lines shows, if the markets go further down, then it will touch 24533 level, which basically will not happen, because markets are recovering now, and the down fall of it sector, was for a particularly us fed hikes , and now the news has been factored in the indices.
coming next to the purple line(the dark orange line), markets will reach till that support only, if markets dont faces any crash or such.
the third line(black line), shows a breakout line to reach the level of 34533. the indice will show its bull run and will give a breakout to black line.
i have even shown the MA-50,100, for your analysis.
very bullish for the IT SECTOR AND ITS ALL STOCKS.
coming next to the purple line(the dark orange line), markets will reach till that support only, if markets dont faces any crash or such.
the third line(black line), shows a breakout line to reach the level of 34533. the indice will show its bull run and will give a breakout to black line.
i have even shown the MA-50,100, for your analysis.
very bullish for the IT SECTOR AND ITS ALL STOCKS.

関連の投稿
免責事項
これらの情報および投稿は、TradingViewが提供または承認する金融、投資、取引、またはその他の種類の助言もしくは推奨であることを意図したものではなく、またこれらに該当するものでもありません。詳細は利用規約をご覧ください。
免責事項
これらの情報および投稿は、TradingViewが提供または承認する金融、投資、取引、またはその他の種類の助言もしくは推奨であることを意図したものではなく、またこれらに該当するものでもありません。詳細は利用規約をご覧ください。