
Coinbase (COIN): MACD supports new bull-market, also Bitcoin & Altcoins
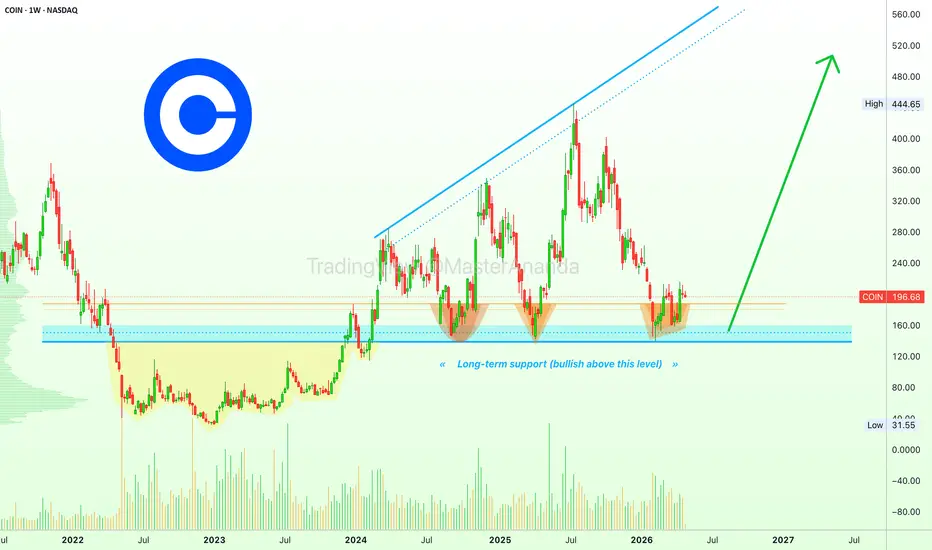
The blue line on the chart reveals a long-term support zone. If we are going to analyze this chart, it cannot be ignored. The bull market and a long lasting bullish period happened above this level. When COIN trades above it, the chart clearly offers bullish conditions. It would be unwise to interpret this chart as bearish when the action is happening above long-term support, the same support that produced a strong reaction recently as well as supported three bullish waves with higher highs.
For doubt, what needs to be considered is short vs long-term. Short-term a retrace can happen, just consider several weeks ago—late March. COIN closed a strong red candle. Followed by two weeks being weak, then it produced a strong green candle. A bottom pattern is in the making. All is happening above support.
Short-term, there can be more noise, more fluctuations, more whale accumulation—all above support. Higher lows since February. The crash started July 2025, same with Bitcoin on the monthly timeframe. Just as the MACD & RSI, much can be gained by looking at different charts across different markets.
July 2025 through February 2026 gives us seven months. Bitcoin and Coinbase move in unison. February through May, another three months. Ten months total. The current chart supports a new wave of growth reaching the previous high or even higher. Can be a double-top before a pause because of the flat support. The flat support and long-term triple bottom can support a new long-term bullish cycle. It can hardly support much bearish action. For additional bearish action, first support needs to break. This is not supported by the chart, prices, oscillators and broader market.
See the weekly MACD:
The MACD supports a new bull market cycle on this stock. Same for the candles, the RSI and Bitcoin. Same for the altcoins.
Namaste.
The blue line on the chart reveals a long-term support zone. If we are going to analyze this chart, it cannot be ignored. The bull market and a long lasting bullish period happened above this level. When COIN trades above it, the chart clearly offers bullish conditions. It would be unwise to interpret this chart as bearish when the action is happening above long-term support, the same support that produced a strong reaction recently as well as supported three bullish waves with higher highs.
For doubt, what needs to be considered is short vs long-term. Short-term a retrace can happen, just consider several weeks ago—late March. COIN closed a strong red candle. Followed by two weeks being weak, then it produced a strong green candle. A bottom pattern is in the making. All is happening above support.
Short-term, there can be more noise, more fluctuations, more whale accumulation—all above support. Higher lows since February. The crash started July 2025, same with Bitcoin on the monthly timeframe. Just as the MACD & RSI, much can be gained by looking at different charts across different markets.
July 2025 through February 2026 gives us seven months. Bitcoin and Coinbase move in unison. February through May, another three months. Ten months total. The current chart supports a new wave of growth reaching the previous high or even higher. Can be a double-top before a pause because of the flat support. The flat support and long-term triple bottom can support a new long-term bullish cycle. It can hardly support much bearish action. For additional bearish action, first support needs to break. This is not supported by the chart, prices, oscillators and broader market.
See the weekly MACD:
- Notice a long-term double-top between April 2024 and July 2025.
- Notice a long-term higher low in February 2026 with a bullish cross.
The MACD supports a new bull market cycle on this stock. Same for the candles, the RSI and Bitcoin. Same for the altcoins.
Namaste.
ノート
Another important level working as support to consider is MA200. It worked in 2025 and also 2026.COIN can be considered bullish as long as it trades above this indicator, the black line on the chart.

Trading Cryptocurrencies can be the hardest undertaking ever without the right trade-numbers, without accurate private-access information. Free is free, but the best always requires sweat, an investment. Since 2017 👇
t.me/masteranandatrades/8778
t.me/masteranandatrades/8778
関連の投稿
免責事項
これらの情報および投稿は、TradingViewが提供または承認する金融、投資、取引、またはその他の種類の助言もしくは推奨であることを意図したものではなく、またこれらに該当するものでもありません。詳細は利用規約をご覧ください。
Trading Cryptocurrencies can be the hardest undertaking ever without the right trade-numbers, without accurate private-access information. Free is free, but the best always requires sweat, an investment. Since 2017 👇
t.me/masteranandatrades/8778
t.me/masteranandatrades/8778
関連の投稿
免責事項
これらの情報および投稿は、TradingViewが提供または承認する金融、投資、取引、またはその他の種類の助言もしくは推奨であることを意図したものではなく、またこれらに該当するものでもありません。詳細は利用規約をご覧ください。