
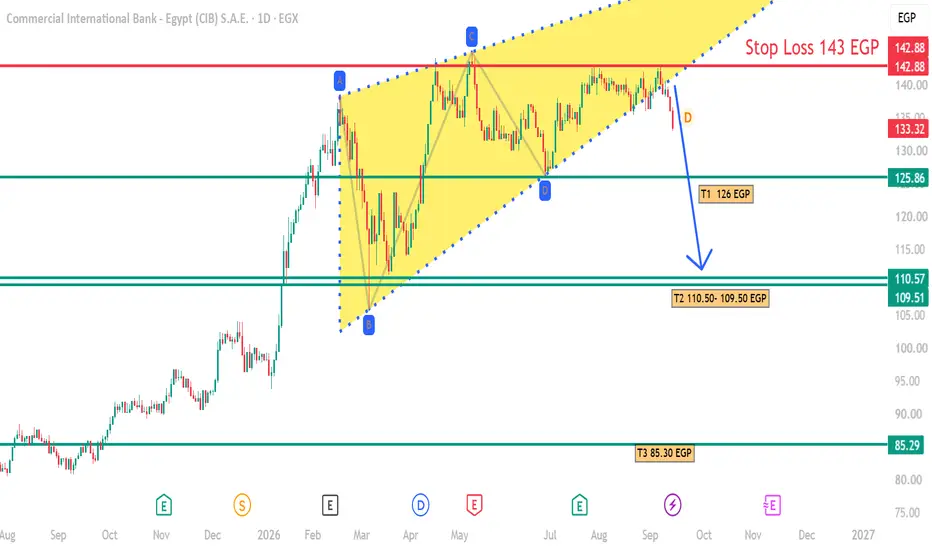
Current Price: 133.32 EGP
The chart shows a bearish reversal setup after a prolonged advance, with price failing to sustain the upper part of the rising structure.
🔴 Bearish Scenario — Primary
The price appears to be forming a rising wedge / ascending channel with bearish implications. The recent rejection from the 140–142.88 EGP resistance zone strengthens the downside case.
Key confirmation:
A sustained daily close below the rising trendline would increase the probability of a deeper correction.
🎯 Downside Targets
Level Role Expected Reaction
126.00 EGP T1 / First support Possible technical bounce
110.57–109.51 EGP T2 / Major support Stronger demand zone
85.29 EGP T3 / Major structural support Extreme bearish target
From 133.32 EGP:
T1 126: ≈ -5.5%
T2 110.57: ≈ -17.1%
T2 109.51: ≈ -17.9%
T3 85.29: ≈ -36.0%
🟢 Critical Resistance / Invalidation
142.88 EGP is the key level.
A daily close above 142.88, particularly with strong volume, would invalidate the current bearish setup and suggest that the bullish trend is still active.
Potential upside continuation would then target 145–150+ EGP, depending on momentum.
📊 Technical Structure
142.88: Major resistance / bearish invalidation
140–142: Supply & rejection zone
133.32: Current price
126.00: First downside target
125.86: Important horizontal support
110.57–109.51: Major support / T2
85.29: Long-term structural support
📌 TradingView-style Conclusion
CIB is showing early signs of a bearish trend reversal after failing to break and hold above the 140–142.88 EGP resistance zone. A confirmed breakdown of the ascending trendline would favor a corrective move toward 126 EGP initially, followed by 110.57–109.51 EGP if selling pressure accelerates.
The bearish thesis remains valid below 142.88 EGP. A decisive daily close above 142.88 would invalidate the setup and restore the bullish continuation scenario.
Risk/Reward: From 133.32 to T2 around 110.5, the potential downside (~17%) is substantially larger than the risk to the 143 EGP invalidation (~7.3%), giving the setup an attractive theoretical R/R of roughly 2.3:1 to T2.
My bias from this chart: 🔴 Bearish below 142.88 | ⚠️ Confirmation below 125.86 | 🎯 126 → 110.57–109.51 → 85.29
トレード稼働中
126 cib target 1トレード終了: 利益確定目標に到達
ACHIVEDノート

免責事項
これらの情報および投稿は、TradingViewが提供または承認する金融、投資、取引、またはその他の種類の助言もしくは推奨であることを意図したものではなく、またこれらに該当するものでもありません。詳細は利用規約をご覧ください。
免責事項
これらの情報および投稿は、TradingViewが提供または承認する金融、投資、取引、またはその他の種類の助言もしくは推奨であることを意図したものではなく、またこれらに該当するものでもありません。詳細は利用規約をご覧ください。