
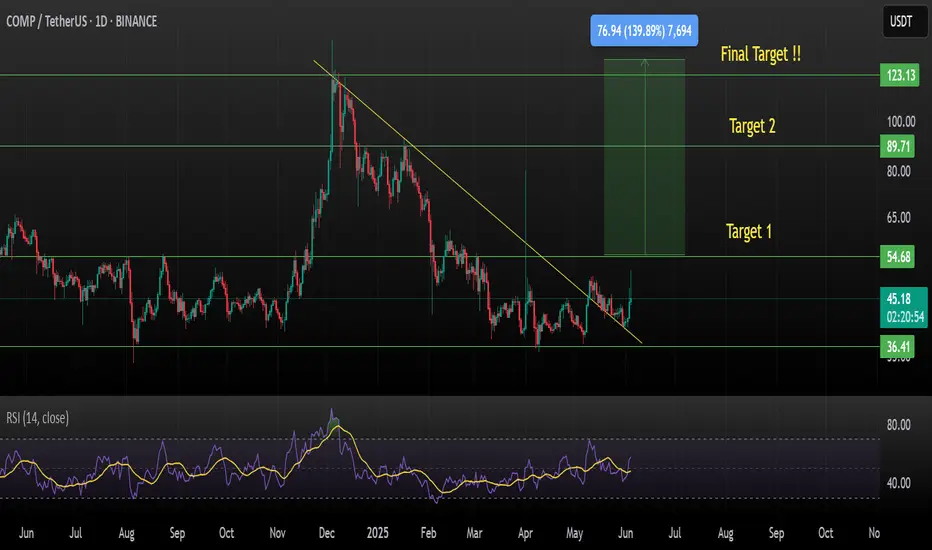
COMPUSDT has broken out of a long-term downtrend line on the daily timeframe, signaling a potential bullish reversal.
Chart Analysis:
Downtrend line broken with a strong bullish candle
RSI recovering to 57.28 — showing improving momentum
Price holding above local support near $36.41
Key Levels:
Support: $36.41
Resistance Levels / Targets:
Target 1: $54.68
Target 2: $89.71
Final Target: $123.13
Bias: Bullish — as long as price sustains above the downtrend line and holds support
Timeframe: 1D
Strategy: Watch for retest of breakout zone ($43–$45) as potential entry, with targets as mentioned.
This is not financial advice, please research before investing, as we are not responsible for any of your losses or profits.
Please like, share, and comment on this idea if you liked it.
#COMPUSDT #CryptoTrading #TechnicalAnalysis #Altcoins #Breakout #BullishSetup
Chart Analysis:
Downtrend line broken with a strong bullish candle
RSI recovering to 57.28 — showing improving momentum
Price holding above local support near $36.41
Key Levels:
Support: $36.41
Resistance Levels / Targets:
Target 1: $54.68
Target 2: $89.71
Final Target: $123.13
Bias: Bullish — as long as price sustains above the downtrend line and holds support
Timeframe: 1D
Strategy: Watch for retest of breakout zone ($43–$45) as potential entry, with targets as mentioned.
This is not financial advice, please research before investing, as we are not responsible for any of your losses or profits.
Please like, share, and comment on this idea if you liked it.
#COMPUSDT #CryptoTrading #TechnicalAnalysis #Altcoins #Breakout #BullishSetup

免責事項
これらの情報および投稿は、TradingViewが提供または承認する金融、投資、取引、またはその他の種類の助言もしくは推奨であることを意図したものではなく、またこれらに該当するものでもありません。詳細は利用規約をご覧ください。
免責事項
これらの情報および投稿は、TradingViewが提供または承認する金融、投資、取引、またはその他の種類の助言もしくは推奨であることを意図したものではなく、またこれらに該当するものでもありません。詳細は利用規約をご覧ください。