
Compound (COMP) technical analysis:
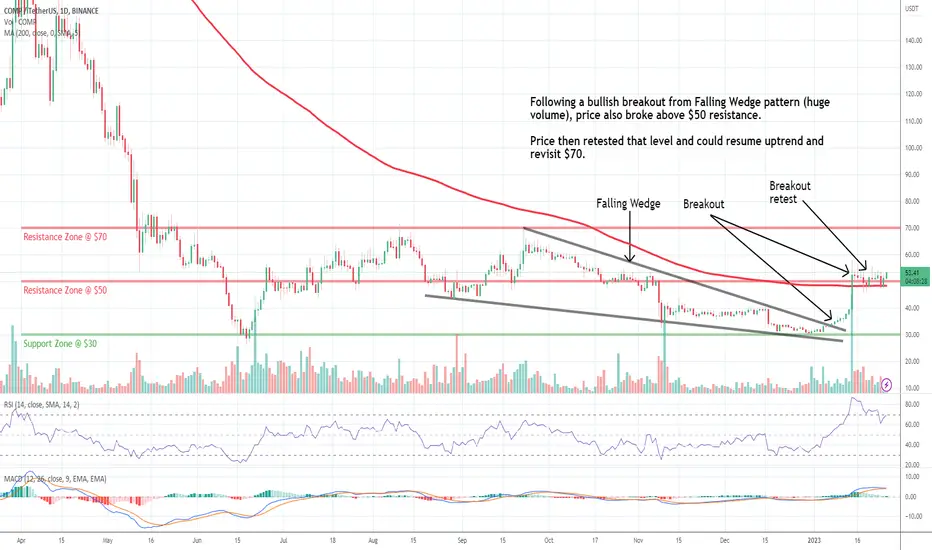
Trade setup: Following a bullish breakout from Falling Wedge pattern (huge volume), price also broke above $50 resistance. Price then retested that level and could resume uptrend and revisit $70. (set a price alert).
Trend: Uptrend on Short- and Medium-Term basis and Downtrend on Long-Term basis.
Momentum is Bullish but inflecting. MACD Line is above MACD Signal Line and RSI is above 55 but momentum may have peaked since MACD Histogram bars are declining, which suggests that momentum is weakening.
Support and Resistance: Nearest Support Zone is $30. The nearest Resistance Zone is $50, which it broke, then $70.
Trade setup: Following a bullish breakout from Falling Wedge pattern (huge volume), price also broke above $50 resistance. Price then retested that level and could resume uptrend and revisit $70. (set a price alert).
Trend: Uptrend on Short- and Medium-Term basis and Downtrend on Long-Term basis.
Momentum is Bullish but inflecting. MACD Line is above MACD Signal Line and RSI is above 55 but momentum may have peaked since MACD Histogram bars are declining, which suggests that momentum is weakening.
Support and Resistance: Nearest Support Zone is $30. The nearest Resistance Zone is $50, which it broke, then $70.

免責事項
これらの情報および投稿は、TradingViewが提供または承認する金融、投資、取引、またはその他の種類の助言もしくは推奨であることを意図したものではなく、またこれらに該当するものでもありません。詳細は利用規約をご覧ください。
免責事項
これらの情報および投稿は、TradingViewが提供または承認する金融、投資、取引、またはその他の種類の助言もしくは推奨であることを意図したものではなく、またこれらに該当するものでもありません。詳細は利用規約をご覧ください。