アップデート済
When It Might End
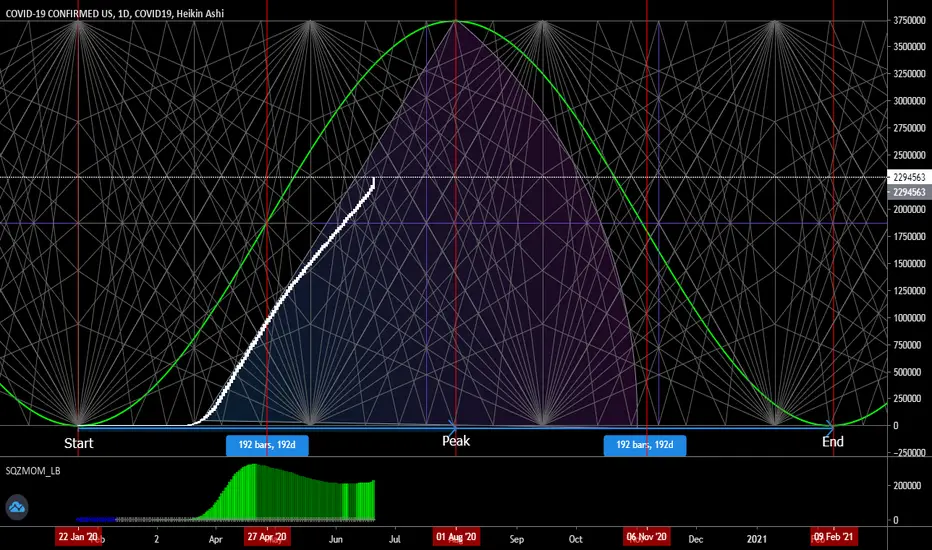
Using Projection, Sine Line, Gann 192 day time cycle, my educated "guess" is this virus will peak around August 2020 with approximately 3.7 million U.S. cases and start to decline until bottoming out in Feburary 2021. Squeeze Momentum Indicator by Lazy Bear showing 2nd wave of infection.
ノート
Looks like August 1st we were at 4.6 million cases, so projection indicator was wrong, but the number of daily case have started to decline so far. Lets see if the pattern holds. If so, the Gann time cycle was correct in predicting the start of decline. Link to see the number of daily cases of US: ourworldindata.org/coronavirus/country/united-states?country=~USA
ノート
Looking to put the nail in the Covid-19 coffin... Soon will be another common cold IMHO... Winter is OVER.
免責事項
これらの情報および投稿は、TradingViewが提供または承認する金融、投資、取引、またはその他の種類の助言もしくは推奨であることを意図したものではなく、またこれらに該当するものでもありません。詳細は利用規約をご覧ください。
免責事項
これらの情報および投稿は、TradingViewが提供または承認する金融、投資、取引、またはその他の種類の助言もしくは推奨であることを意図したものではなく、またこれらに該当するものでもありません。詳細は利用規約をご覧ください。