
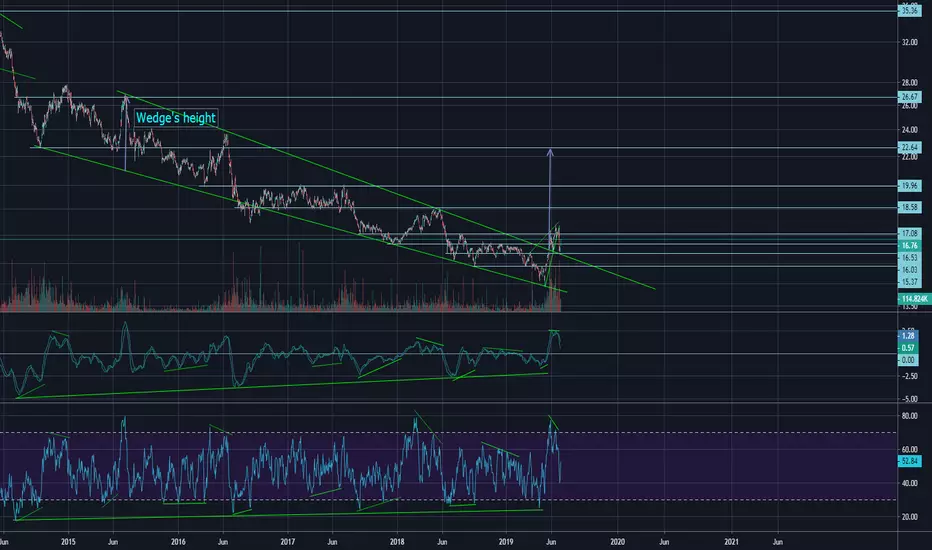
CORN has broken out of a bullish descending wedge pattern to the upside, entered a bearish rising wedge, broken down and back-tested the previous resistance level before bouncing back. There are positive divergences on the charts which suggest a much longer up trend in play. These positive divergences can also be seen on the weekly and monthly charts of CORN which also firm up the thesis of a new long term uptrend. When measuring the height of the wedge pattern and adding it to the breakout point, the anticipated price coincides with a former support/resistance level.

免責事項
これらの情報および投稿は、TradingViewが提供または承認する金融、投資、取引、またはその他の種類の助言もしくは推奨であることを意図したものではなく、またこれらに該当するものでもありません。詳細は利用規約をご覧ください。
免責事項
これらの情報および投稿は、TradingViewが提供または承認する金融、投資、取引、またはその他の種類の助言もしくは推奨であることを意図したものではなく、またこれらに該当するものでもありません。詳細は利用規約をご覧ください。