
Hello, traders!
Most of us asked me today to analyze Coti. Here you are. I hope you’ll enjoy my thoughts. Well, have a look at the chart.
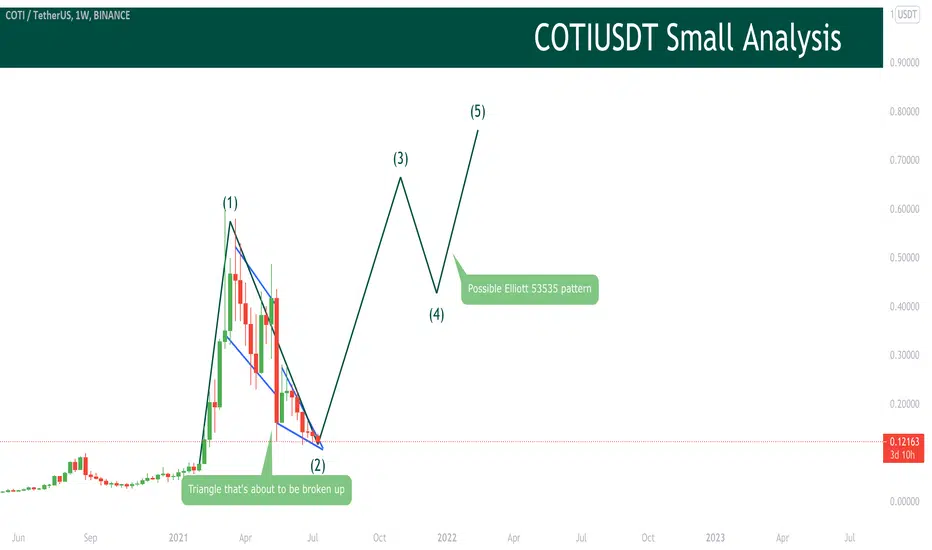
As you can see both on daily and weekly chart price is at the end of the cycle. That’s why it’s a good opportunity to earn some money. As we see on the daily chart, price is near the weekly pivot and the triangle will be broken up soon. I’m completely sure that it’ll go up with high probability of blowing up. I mean it, guys. The most pretty nice info the weekly chart gives. The previous price action looks like the first part of Elliott cycle. If it’s true, but I’m sure it is, it’ll blow very soon. So, I plotted the long opportunity on the chart.

I hope, you are making your own analysis besides using my. I remember you, that it’s deadly important to get huge profits and boost your own trading skills. That’s why, don’t just follow my thoughts blindly. Analyze, think, and will gain success. Have a profitable day, traders!
DISCLAMER: Information is provided only for educational purposes. Do your own study before taking any actions or decisions at the real market.
Most of us asked me today to analyze Coti. Here you are. I hope you’ll enjoy my thoughts. Well, have a look at the chart.
As you can see both on daily and weekly chart price is at the end of the cycle. That’s why it’s a good opportunity to earn some money. As we see on the daily chart, price is near the weekly pivot and the triangle will be broken up soon. I’m completely sure that it’ll go up with high probability of blowing up. I mean it, guys. The most pretty nice info the weekly chart gives. The previous price action looks like the first part of Elliott cycle. If it’s true, but I’m sure it is, it’ll blow very soon. So, I plotted the long opportunity on the chart.
I hope, you are making your own analysis besides using my. I remember you, that it’s deadly important to get huge profits and boost your own trading skills. That’s why, don’t just follow my thoughts blindly. Analyze, think, and will gain success. Have a profitable day, traders!
DISCLAMER: Information is provided only for educational purposes. Do your own study before taking any actions or decisions at the real market.

免責事項
これらの情報および投稿は、TradingViewが提供または承認する金融、投資、取引、またはその他の種類の助言もしくは推奨であることを意図したものではなく、またこれらに該当するものでもありません。詳細は利用規約をご覧ください。
免責事項
これらの情報および投稿は、TradingViewが提供または承認する金融、投資、取引、またはその他の種類の助言もしくは推奨であることを意図したものではなく、またこれらに該当するものでもありません。詳細は利用規約をご覧ください。