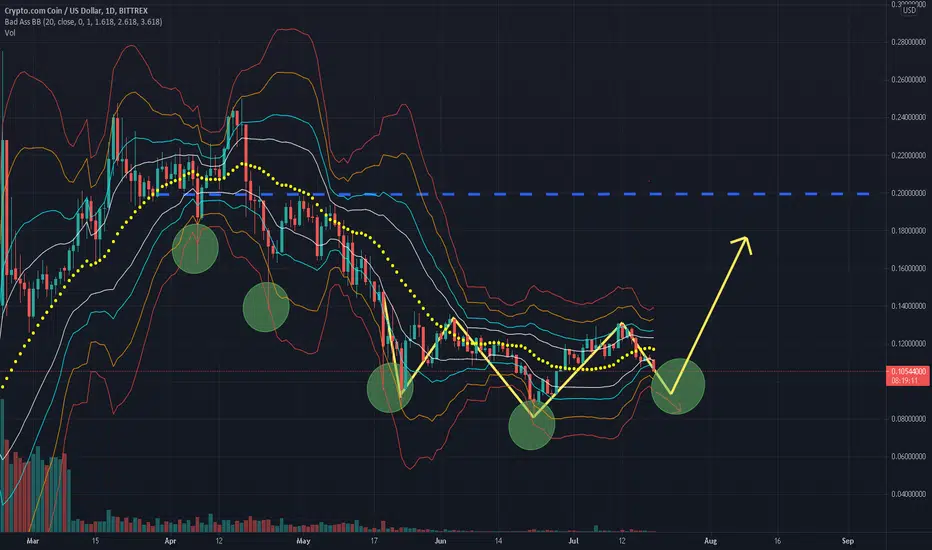
Inverse H & S pattern showing. Daily candles also look like they're inching toward the red lower Bollinger Band, indicating strong potential for a bounce. I believe we still need the right shoulder to connect with the left shoulder of the pattern at approx $0.09~ for the bounce to occur. The target for this pattern would be just below $0.20 where last resistance occurred.
Not financial advice, just my opinion.
Not financial advice, just my opinion.

免責事項
これらの情報および投稿は、TradingViewが提供または承認する金融、投資、取引、またはその他の種類の助言もしくは推奨であることを意図したものではなく、またこれらに該当するものでもありません。詳細は利用規約をご覧ください。
免責事項
これらの情報および投稿は、TradingViewが提供または承認する金融、投資、取引、またはその他の種類の助言もしくは推奨であることを意図したものではなく、またこれらに該当するものでもありません。詳細は利用規約をご覧ください。