CS Group - CSGN
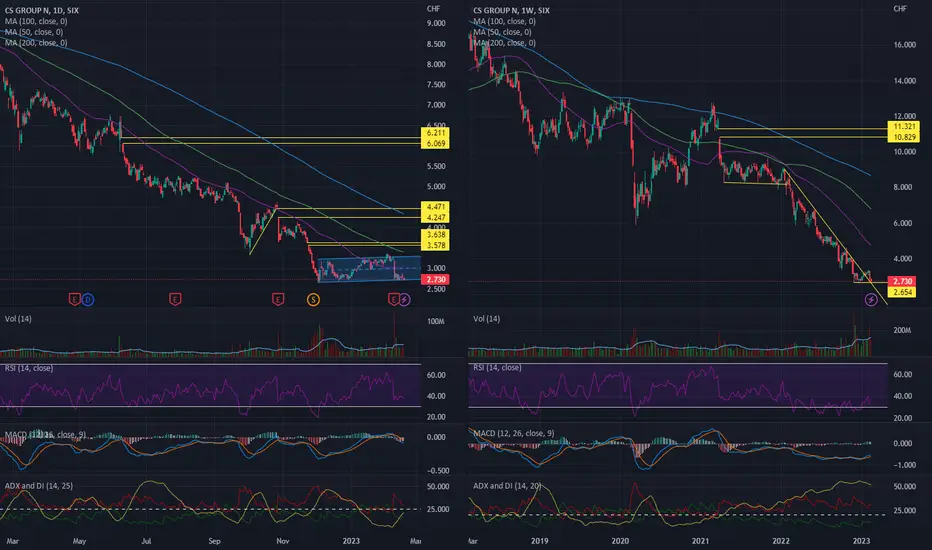
• Slightly upside corridor since beginning December 2022 (daily chart on the left side)
• The stock is currently trading at the bottom of the corridor (left side chart)
• Low volume in the last days (left side chart)
• Break out of the decreasing trend line in the last weeks (weekly chart on the right side)
• Supportline at 2.654 (right side chart)
• MACD line crossed the MACD Signal upward, which supports the outbreak of the decreasing trendline (right side chart)
• Stay neutral and wait if the support will hold
• The stock is currently trading at the bottom of the corridor (left side chart)
• Low volume in the last days (left side chart)
• Break out of the decreasing trend line in the last weeks (weekly chart on the right side)
• Supportline at 2.654 (right side chart)
• MACD line crossed the MACD Signal upward, which supports the outbreak of the decreasing trendline (right side chart)
• Stay neutral and wait if the support will hold

免責事項
これらの情報および投稿は、TradingViewが提供または承認する金融、投資、取引、またはその他の種類の助言もしくは推奨であることを意図したものではなく、またこれらに該当するものでもありません。詳細は利用規約をご覧ください。
免責事項
これらの情報および投稿は、TradingViewが提供または承認する金融、投資、取引、またはその他の種類の助言もしくは推奨であることを意図したものではなく、またこれらに該当するものでもありません。詳細は利用規約をご覧ください。