ロング
Casper Bottomed Out | Multiple Timeframes (160% Target Mapped)
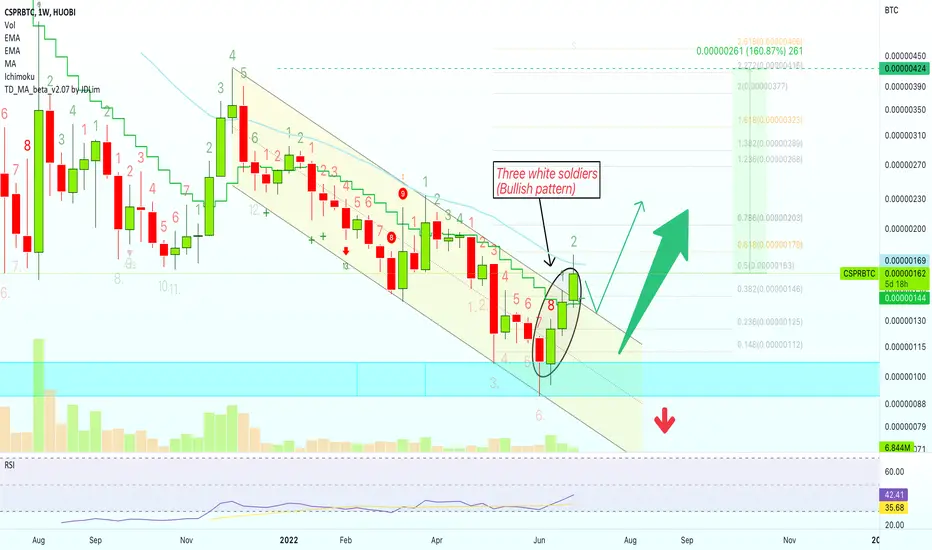
Good to write for you again and here we have the classic bottom formation we've been seeing over and over... This is the CSPRBTC pair or Casper.
We have the lower low followed by strong bullish action.
We have the "W pattern" which normally signals a low/bottom/support.
CSPRBTC Daily

CSPRBTC Weekly (main chart)

This is all for this pair.
Thank you for reading.
Namaste.
We have the lower low followed by strong bullish action.
We have the "W pattern" which normally signals a low/bottom/support.
CSPRBTC Daily
- - There can be a retrace after the initial breakout.
- - The retrace tends to end in a higher low which leads to a higher high.
- - Patience is key as everything will move but it takes time.
CSPRBTC Weekly (main chart)
- - We can see a broken descending channel.
- - The RSI rising.
- - Three White Soldiers pattern (confirms only after this weekly candle close).
- - Trading above EMA10.
- - 160% Target mapped.
This is all for this pair.
Thank you for reading.
Namaste.

💯 Trading signals (results)
— Late 2026👇
t.me/masteranandatrades/9279
🔥 10-25X Leverage
—Trade-numbers:
t.me/masteranandatrades/9271
✅ PREMIUM &Content
—One-Time Payment
t.me/lamatrades/4 (🔝 since 2017)
— Late 2026👇
t.me/masteranandatrades/9279
🔥 10-25X Leverage
—Trade-numbers:
t.me/masteranandatrades/9271
✅ PREMIUM &Content
—One-Time Payment
t.me/lamatrades/4 (🔝 since 2017)
関連の投稿
免責事項
これらの情報および投稿は、TradingViewが提供または承認する金融、投資、取引、またはその他の種類の助言もしくは推奨であることを意図したものではなく、またこれらに該当するものでもありません。詳細は利用規約をご覧ください。