
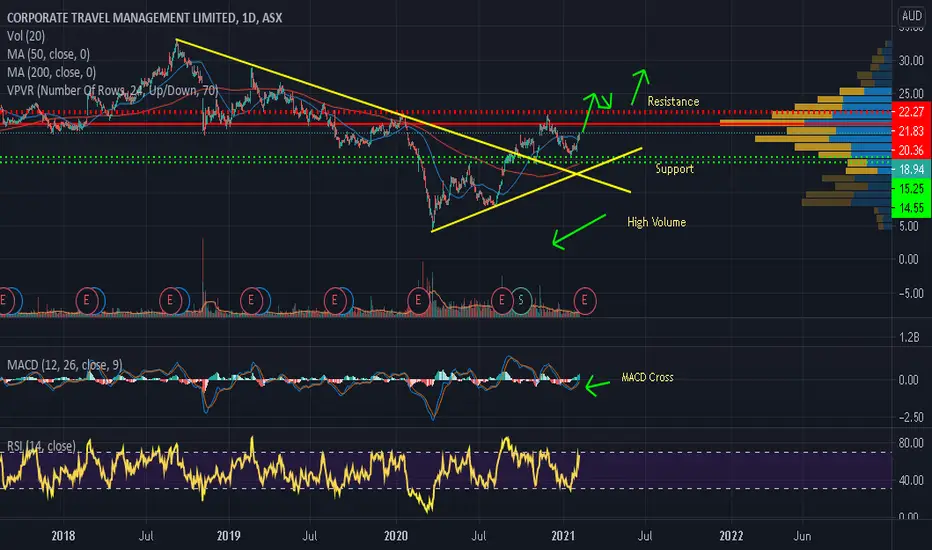
CTD had broken out of the downtrend line in October with High Volume, and followed through with Bullish Price Action in the Month Of November. It made a high of $21.76 on the 26th of November and since then it has been retracing lower. Recent price action suggests that its retracement is over after finding Support and bouncing off at $15.50 (200 SMA). Currently it is at $18.94, coupled with a MACD cross also indicating it wants to continue higher towards the previous High of $21.76.
If CTD manages to close higher then its previous Highs above $21.76, we may see it continue higher towards its next Resistance which lies at $23.00.
Please note these are my own notes for future reference, by no means trading advice to anyone. Please do your own research before entering into any trade.
If CTD manages to close higher then its previous Highs above $21.76, we may see it continue higher towards its next Resistance which lies at $23.00.
Please note these are my own notes for future reference, by no means trading advice to anyone. Please do your own research before entering into any trade.

免責事項
これらの情報および投稿は、TradingViewが提供または承認する金融、投資、取引、またはその他の種類の助言もしくは推奨であることを意図したものではなく、またこれらに該当するものでもありません。詳細は利用規約をご覧ください。
免責事項
これらの情報および投稿は、TradingViewが提供または承認する金融、投資、取引、またはその他の種類の助言もしくは推奨であることを意図したものではなく、またこれらに該当するものでもありません。詳細は利用規約をご覧ください。