#CTSI/BTC (May 31)
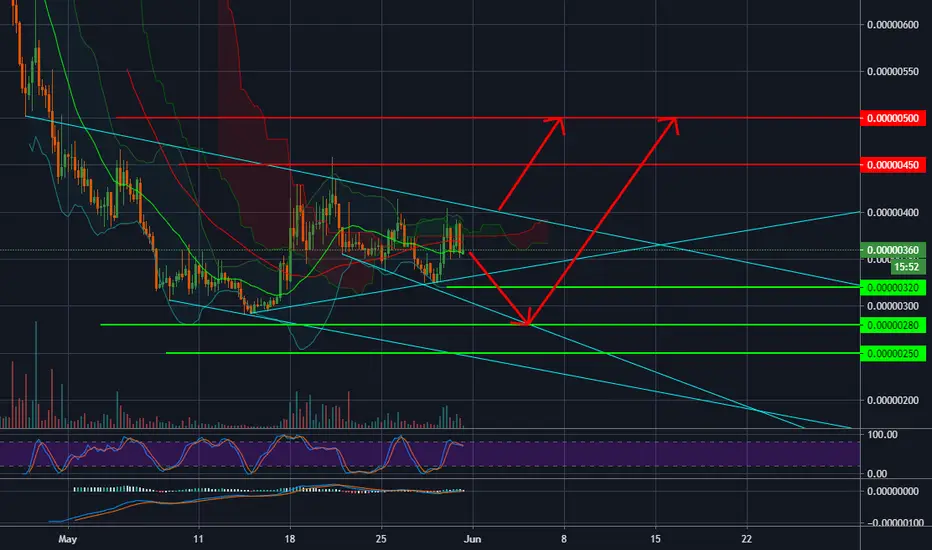
At this moment, what we can see on CTSI chart is that the selling force is dominant and the purpose of pushing the price up is to sell large quantities of CTSI.
In addition, CTSI is in a very bad pattern, Symmetrical Triangle in downtrend, so the price direction is moving down.
We will buy CTSI in 2 cases :
- Break out and stand stable above 400sts
- Catch gradually at these points : 320 - 280 and 250sts
The nearest sell target is 450 and 500
In addition, CTSI is in a very bad pattern, Symmetrical Triangle in downtrend, so the price direction is moving down.
We will buy CTSI in 2 cases :
- Break out and stand stable above 400sts
- Catch gradually at these points : 320 - 280 and 250sts
The nearest sell target is 450 and 500

免責事項
これらの情報および投稿は、TradingViewが提供または承認する金融、投資、取引、またはその他の種類の助言もしくは推奨であることを意図したものではなく、またこれらに該当するものでもありません。詳細は利用規約をご覧ください。
免責事項
これらの情報および投稿は、TradingViewが提供または承認する金融、投資、取引、またはその他の種類の助言もしくは推奨であることを意図したものではなく、またこれらに該当するものでもありません。詳細は利用規約をご覧ください。