更新済
Wait & watch
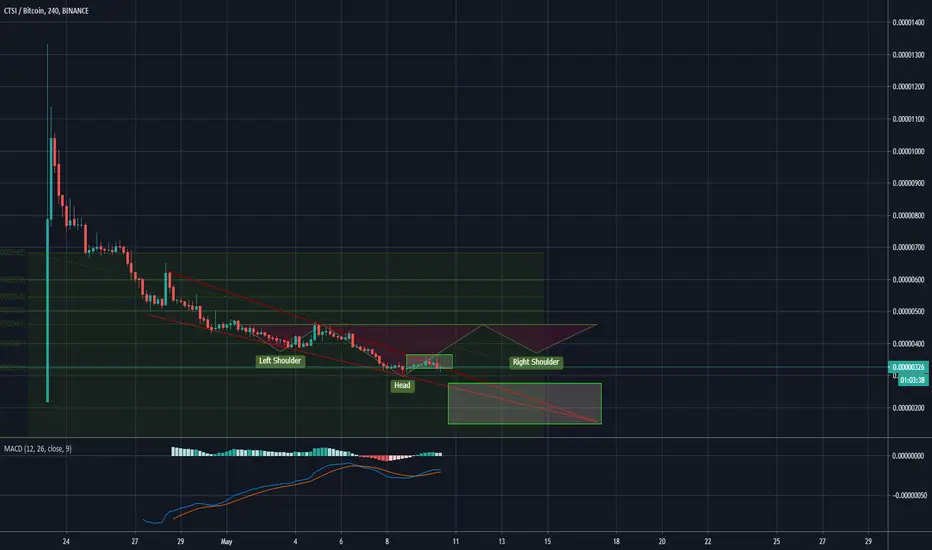
After last positive analysis, CTSI has fallen back into his downtrend falling wedge pattern.
Best buy for us would be when we breakout with volume out of this wedge which is indicated with a green rectangle box.
Alternatively, accumulation range would be between 150-250 sats from which we can expect a upward movement confidently.
Regards
Best buy for us would be when we breakout with volume out of this wedge which is indicated with a green rectangle box.
Alternatively, accumulation range would be between 150-250 sats from which we can expect a upward movement confidently.
Regards
トレード稼働中
Trying to break out of the 4 step downward parabolic curve formation, The volume is there but i would personally be weary to enter the trade when BTC is at the crucial juncture of 10k.
CTSI needs to break 417sats to break from the primary resistance of the curve.
トレード終了: 利益確定目標に到達

関連の投稿
免責事項
これらの情報および投稿は、TradingViewが提供または承認する金融、投資、取引、またはその他の種類の助言もしくは推奨であることを意図したものではなく、またこれらに該当するものでもありません。詳細は利用規約をご覧ください。
免責事項
これらの情報および投稿は、TradingViewが提供または承認する金融、投資、取引、またはその他の種類の助言もしくは推奨であることを意図したものではなく、またこれらに該当するものでもありません。詳細は利用規約をご覧ください。