ロング
Cartesi Breaks Falling Wedge (Short-Term Move)
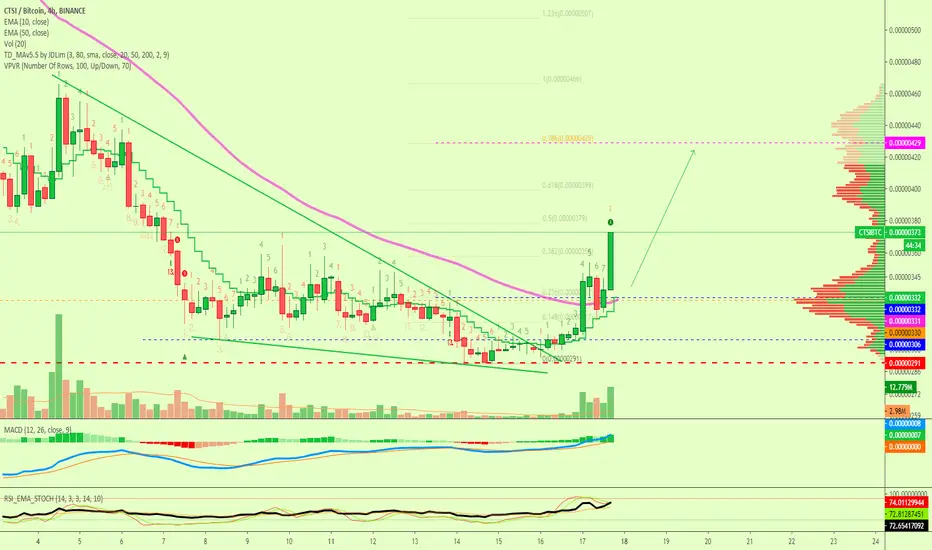
CTSIBTC just broke above resistance and is starting to gain momentum.
I've marked the next short-term target on this chart.
Cartesi (CTSIBTC) Chart Signals
Prices can go straight up as shown by the green arrow.
Conditions for change
On a drop, support can be found around 0.00000333.
Thanks a lot for reading.
Namaste.
I've marked the next short-term target on this chart.
Cartesi (CTSIBTC) Chart Signals
- Here we can notice the volume bars going green and becoming bigger, there can easily be more growth.
- EMA10 is moving above EMA50.
- We also have a strong RSI.
Prices can go straight up as shown by the green arrow.
Conditions for change
On a drop, support can be found around 0.00000333.
Thanks a lot for reading.
Namaste.
トレード終了: 利益確定目標に到達
Perfect hit.
✅ Cryptocurrencies technical analysis & results
t.me/masteranandatrades/9279
✅ Stocks technical analysis
t.me/anandastocks
✅ Enjoyed the content? Join my PREMIUM channels for more... t.me/lamatrades/4 (since 2017)
t.me/masteranandatrades/9279
✅ Stocks technical analysis
t.me/anandastocks
✅ Enjoyed the content? Join my PREMIUM channels for more... t.me/lamatrades/4 (since 2017)
関連の投稿
免責事項
これらの情報および投稿は、TradingViewが提供または承認する金融、投資、取引、またはその他の種類の助言もしくは推奨であることを意図したものではなく、またこれらに該当するものでもありません。詳細は利用規約をご覧ください。
✅ Cryptocurrencies technical analysis & results
t.me/masteranandatrades/9279
✅ Stocks technical analysis
t.me/anandastocks
✅ Enjoyed the content? Join my PREMIUM channels for more... t.me/lamatrades/4 (since 2017)
t.me/masteranandatrades/9279
✅ Stocks technical analysis
t.me/anandastocks
✅ Enjoyed the content? Join my PREMIUM channels for more... t.me/lamatrades/4 (since 2017)
関連の投稿
免責事項
これらの情報および投稿は、TradingViewが提供または承認する金融、投資、取引、またはその他の種類の助言もしくは推奨であることを意図したものではなく、またこれらに該当するものでもありません。詳細は利用規約をご覧ください。