ロング
CTXCUSDT
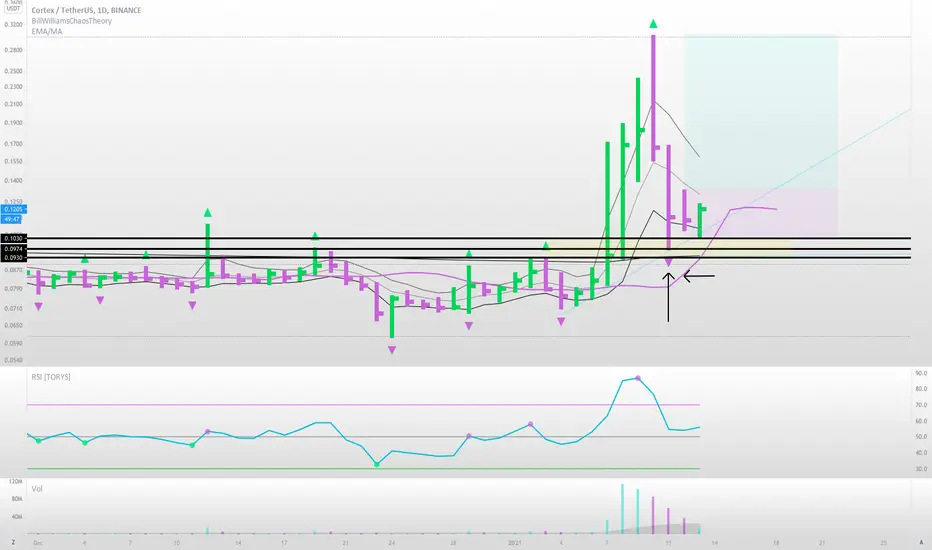
A volume diversion bar has formed on the daily chart. Fractal is above the 13ema and price has pushed into the high/low 5ema channel without crossing the high. Price is above the 200ema and RSI above 50, which tells us this is an up-trending market. The first target is the last fractal high or a volume diversion bar to the downside. A stop will be placed below the prior daily candle 13-01-2021. Enter on today's candle 14-01-2021. Good luck!
ノート
Price targets are just a guide. Please watch for a change in market sentiment!ノート
Target !. ノート
Comment: If angulation remains strong - doesn't slip between dashed lines and price pulls further away, remain in the trade! angulation is very important! This could be a widening wedge pattern and could actually see price slip to the downside. Take profit and move your stop loss up at the end of each daily candle.ノート
Move your stop to breakeven!ノート
4hr 手動でトレードを終了しました
ノート
All trades are still active. Ignore the comment above -ノート
トレード終了: ストップロスに到達

免責事項
これらの情報および投稿は、TradingViewが提供または承認する金融、投資、取引、またはその他の種類の助言もしくは推奨であることを意図したものではなく、またこれらに該当するものでもありません。詳細は利用規約をご覧ください。
免責事項
これらの情報および投稿は、TradingViewが提供または承認する金融、投資、取引、またはその他の種類の助言もしくは推奨であることを意図したものではなく、またこれらに該当するものでもありません。詳細は利用規約をご覧ください。