
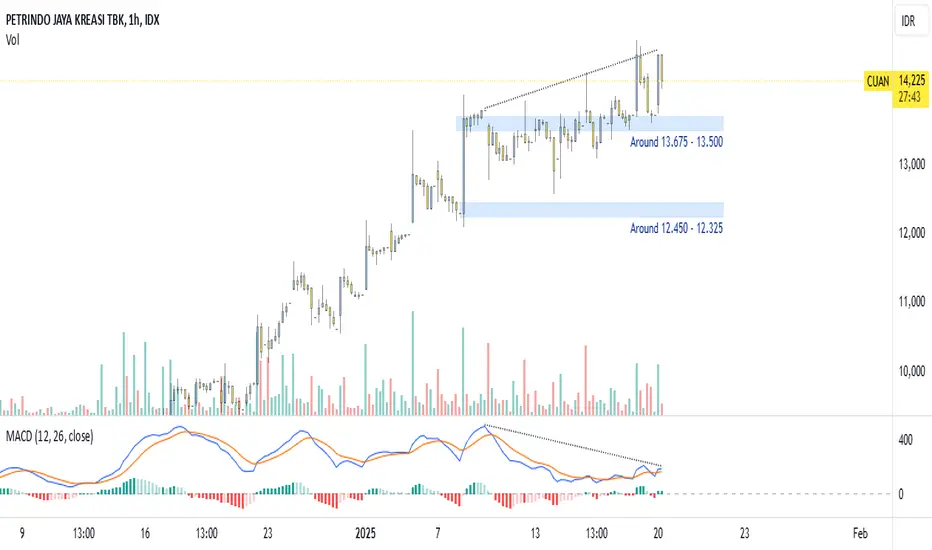
CUAN has been experiencing significant trading volume, particularly after its inclusion in the FTSE index. Given its strong uptrend, it is important to be cautious of potential reversals, especially since the current price is near its all-time high. A bearish divergence is observed on the 1-hour chart using the MACD indicator, as the candlestick pattern shows an upward trend while the MACD line indicates a downward trend. This divergence could signal a minor correction within the major uptrend, with a potential price pullback to the first support level (13,675 - 13,500). This potential correction presents an opportunity to enter new positions at a more attractive price, considering the average market price of big funds at 12,138, based on accumulation since December 12, 2024. However, this bearish signal would be more confirmed if the MACD line crosses below the signal line.
Disclaimer: This analysis is for general information purposes only and does not constitute financial advice. Investment decisions should be made based on an individual's specific financial situation and after consulting with a qualified financial advisor. The author is not responsible for any investment losses
Disclaimer: This analysis is for general information purposes only and does not constitute financial advice. Investment decisions should be made based on an individual's specific financial situation and after consulting with a qualified financial advisor. The author is not responsible for any investment losses

免責事項
これらの情報および投稿は、TradingViewが提供または承認する金融、投資、取引、またはその他の種類の助言もしくは推奨であることを意図したものではなく、またこれらに該当するものでもありません。詳細は利用規約をご覧ください。
免責事項
これらの情報および投稿は、TradingViewが提供または承認する金融、投資、取引、またはその他の種類の助言もしくは推奨であることを意図したものではなく、またこれらに該当するものでもありません。詳細は利用規約をご覧ください。