
** investment opportunity **
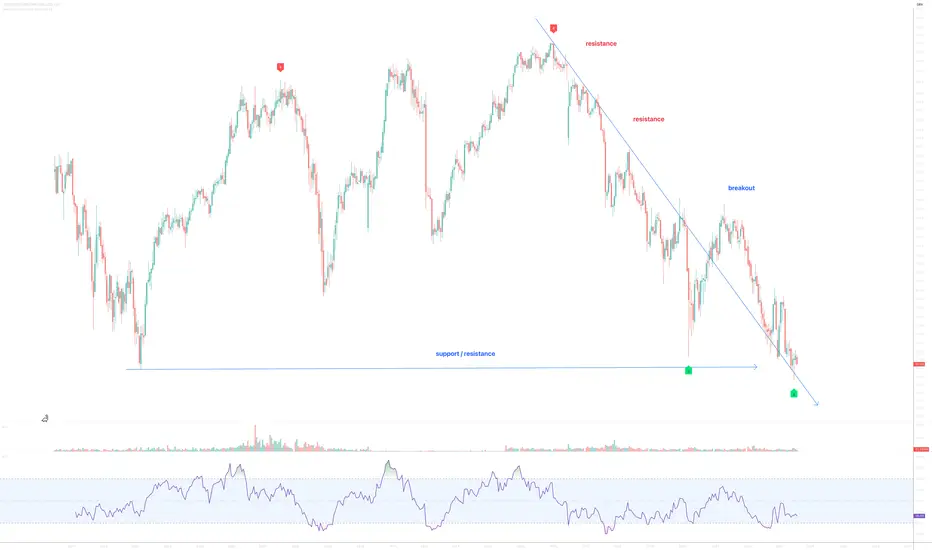
On the above 12 day chart price action has corrected 90% since 2016. An excellent long opportunity. Why?
1) Price action and RSI resistance breakouts.
2) Price action on macro support and resistance.
3) Strong bullish divergence as measured over..
4) Some other stuff, will say elsewhere.
Is it possible price action falls further? Sure.
Is it probable? no
Ww
Type: Investment
Risk: <=6% of portfolio
Timeframe: Be long before the summer turns to Autumn
Return: Will say elsewhere
Stop loss: Will say elsewhere
On the above 12 day chart price action has corrected 90% since 2016. An excellent long opportunity. Why?
1) Price action and RSI resistance breakouts.
2) Price action on macro support and resistance.
3) Strong bullish divergence as measured over..
4) Some other stuff, will say elsewhere.
Is it possible price action falls further? Sure.
Is it probable? no
Ww
Type: Investment
Risk: <=6% of portfolio
Timeframe: Be long before the summer turns to Autumn
Return: Will say elsewhere
Stop loss: Will say elsewhere
トレード稼働中
support confirmedノート
Up 30% so far.ノート
60% return until now. No action required.ノート
Add to existing long positions between 62 and 65ノート
Well done if you added to existing long positions from the recent market hiccups.The next retail FOMO rush will take price action to 140.
トレード稼働中
** resistance breakout **Keep holding until around 700
ノート
up and up... ノート
Happy you snapped it up at 50 ?? ノート
Up around 160% Daily signal indicates 80% chance of correction in price action before the next leg up.

免責事項
これらの情報および投稿は、TradingViewが提供または承認する金融、投資、取引、またはその他の種類の助言もしくは推奨であることを意図したものではなく、またこれらに該当するものでもありません。詳細は利用規約をご覧ください。
免責事項
これらの情報および投稿は、TradingViewが提供または承認する金融、投資、取引、またはその他の種類の助言もしくは推奨であることを意図したものではなく、またこれらに該当するものでもありません。詳細は利用規約をご覧ください。